TED has 105M backlinks and earns $120K a month from them — the lowest return per link in this series.
Dribbble has almost exactly the same link count and earns $800K. Docker Hub has 30% fewer links and earns $290K.
I ran ted.com through our tools alongside 14 other large sites. It is the most famous brand in the set and the worst at converting that fame into search value — and the reason is a single characteristic of the queries it wins. Here are the 8 lessons.
Judge your links by what they earn
Our Backlink Analyzer reports 105M backlinks, and an earlier measurement recorded 910K referring domains at 96% dofollow — the highest referring-domain count of any site in this series except Eventbrite.
Free, and it prices the traffic honestly. If you want to find the queries in your market that advertisers do bid on, Semrush and SE Ranking both sort by cost per click, and that list is where the money is.
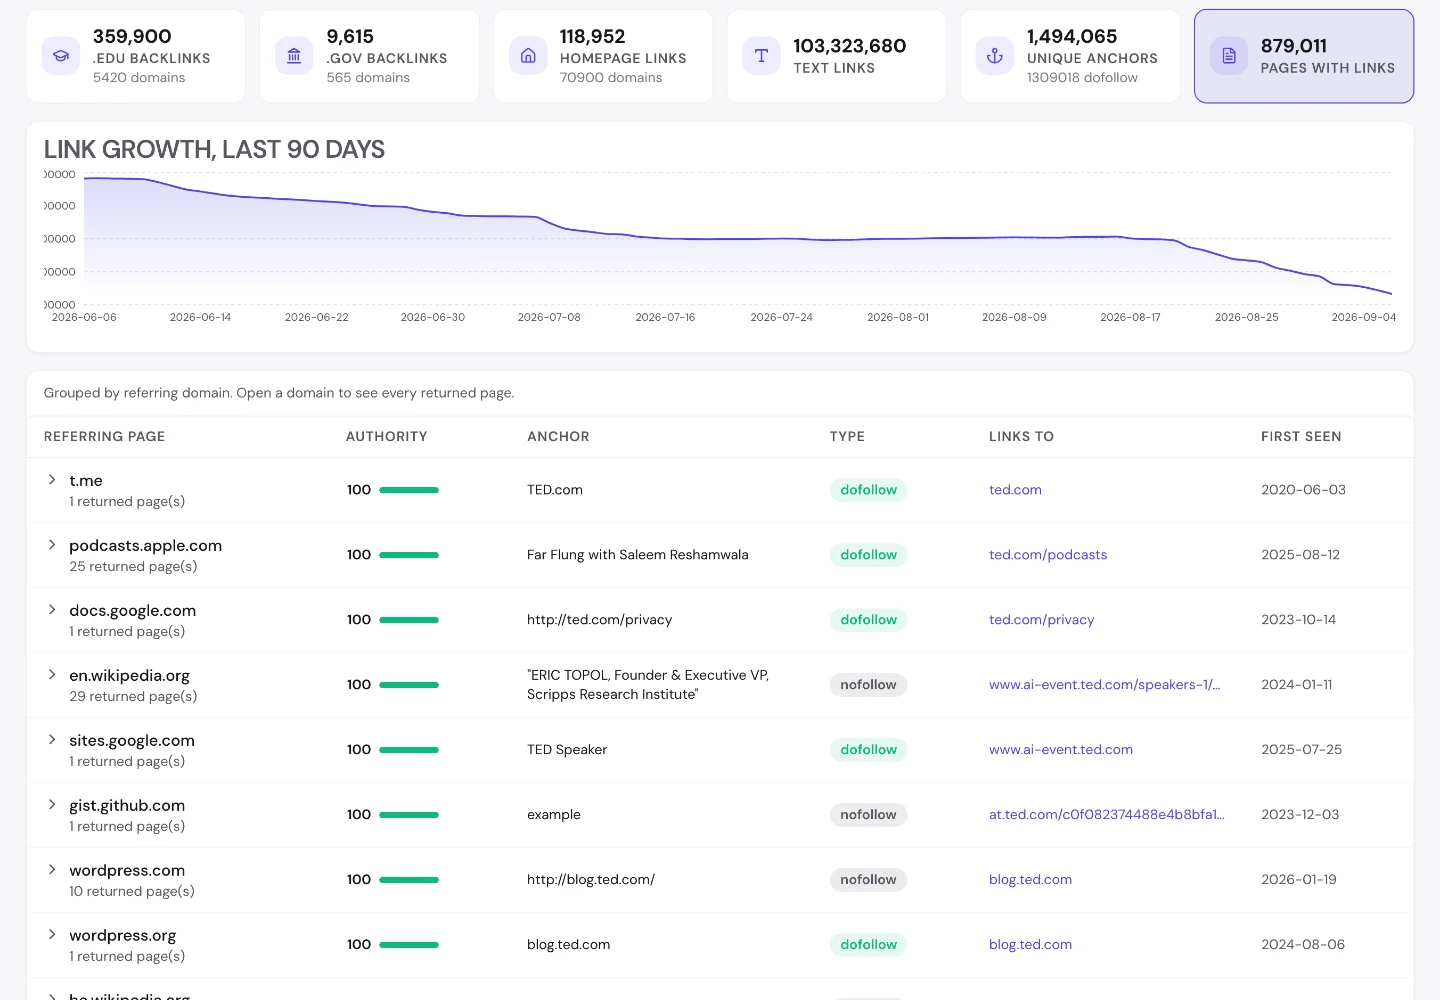
The Domain Overview prices the resulting traffic at $120K a month.
Dribbble, with 105M backlinks, earns $800K. Same link count, 6x the value.
The difference is not authority, it is commerce. Nobody bids on "ted talk".
Advertisers bid on "logo design" and "docker image", so those queries cost money and TED's do not. Traffic value measures what traffic would cost to buy, and inspiration is cheap.
So judge your own links by what they earn you, not by how many there are. A profile this size in a market nobody bids on will never turn into revenue, however impressive it looks in a report.
Check you are comparing markets, not teams
Stated plainly, because it is the trap in this whole metric.
TED is one of the most recognised media brands on earth. It converts that into 300K US organic visits and a modelled ad-equivalent of $120K — behind chess.com, Open Library and PyPI on value per visit.
If you had judged TED's SEO on traffic value alone you would conclude it was failing. It is not. It is winning enormous volumes of a query type nobody monetises.
So when you benchmark against a competitor, check whether you are comparing performance or comparing markets. A media brand and a B2B tool can have identical traffic and a 10x gap in traffic value, and neither one is doing anything wrong.
Look inside your domain-level number
The Organic Traffic Checker shows the homepage taking 13% of the traffic. The next 2 biggest pages are not on the main site at all.
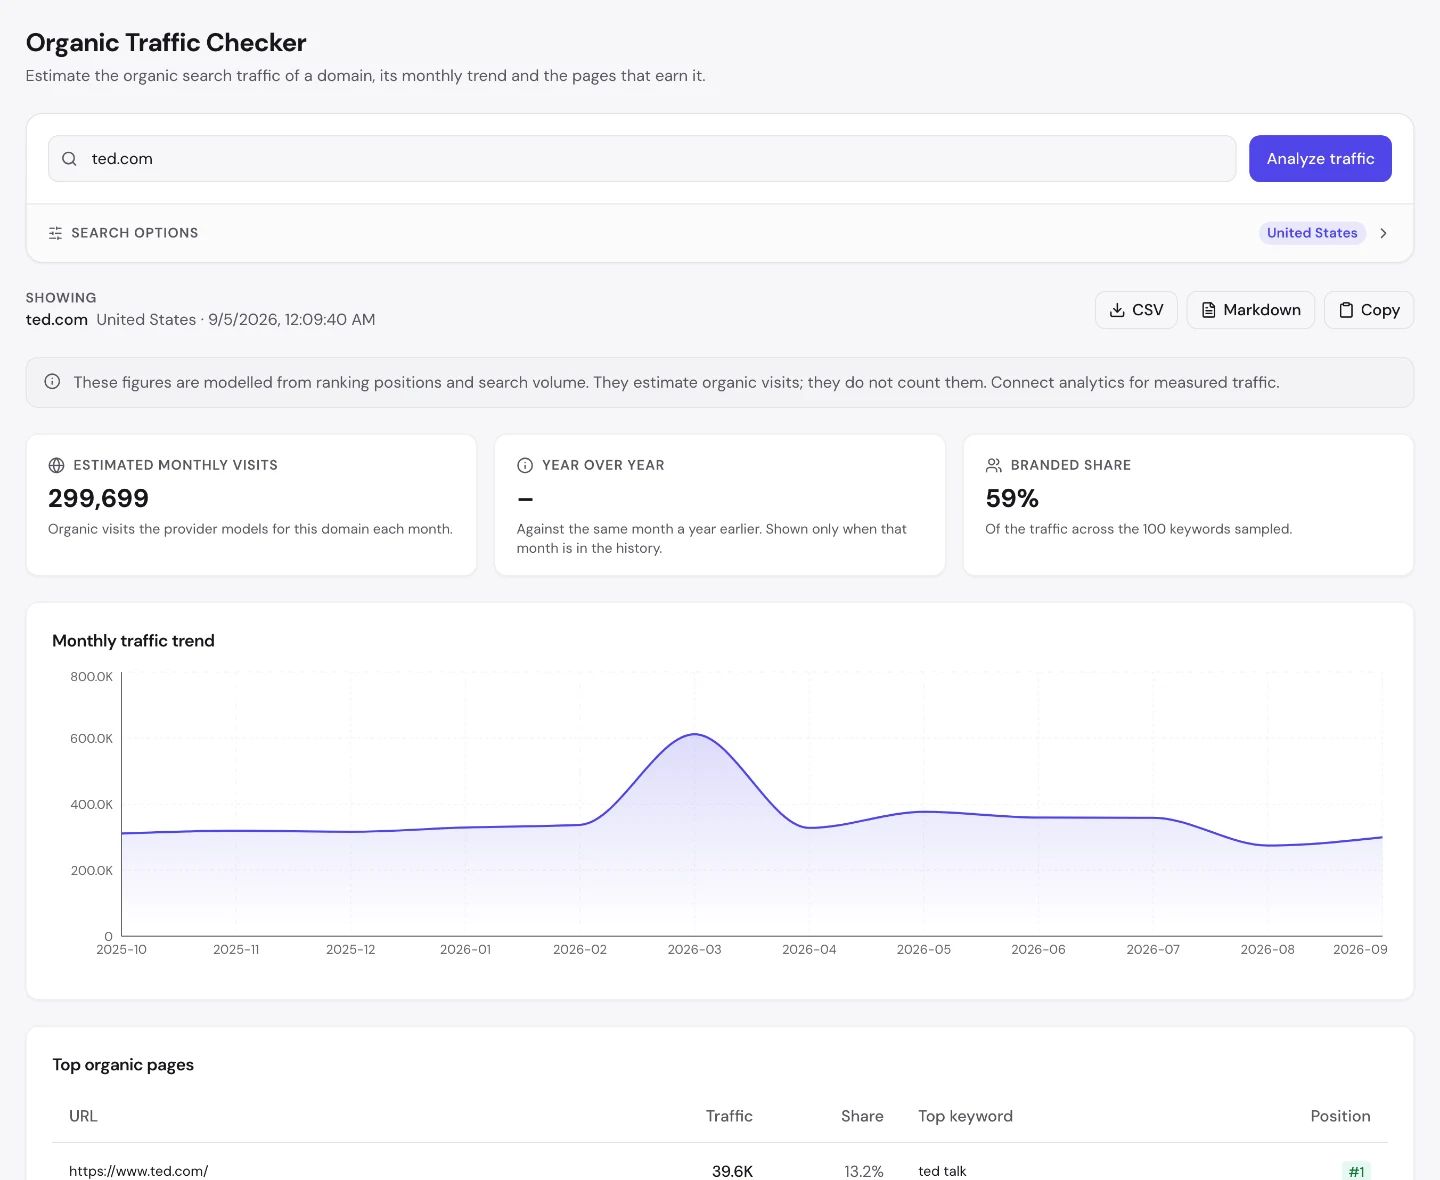
2 of the 3 biggest pages are not the main site. TED-Ed is a separate education product; ideas.ted.com is an editorial blog, and the single article ranking there is about love languages — not a talk at all.
The talks themselves appear at 4% (/talks) and 1% (a playlist).
We found the same subdomain effect in a separate case study on GOV.UK, where a weather forecast takes 44% of a whole government's search traffic.
So if you measure at the domain level, look inside the number before you credit it to your core product. Your best-performing page may belong to a team you never talk to.
Build the scaffolding around your asset
An earlier full crawl found 120K URLs across 29 child sitemap files. The curated video library is only 7% of that.
The other 94% is largely year-bucketed archive pages: 97K URLs, about 12.7 archive pages for every curated video.
So the thing TED is famous for is a twentieth of what TED publishes. The rest is scaffolding built around it — browse pages, year buckets, playlists, transcripts.
That ratio is the real lesson, and I keep finding it. I saw the same thing in separate case studies on itch.io, whose tag directories carry the traffic, and on Eventbrite and Dribbble.
Your asset earns the attention. The scaffolding around it earns the search traffic. Most people build the asset and stop there, which is why the scaffolding is nearly always the cheapest thing you can build next.
Publish the archive around the asset
The copyable version, since TED's is unusually clean.
Take whatever your core content is — talks, episodes, releases, case studies — and generate the layers people actually search: by year, by theme, by speaker, by length, "most popular", "best of". TED's most popular playlist alone ranks first and earns 4,100 visits.
None of that requires new content. It requires deciding which slices have demand, which you can check with Keyword Research and group with the Keyword Cluster tool before you build 29 sitemap files of them.
And write the slice pages as pages. A bare list of links is thin; a browse page with a paragraph explaining what the slice is and who it is for is a page. The Content Optimizer will tell you what the ones already ranking include.
TED has 105M backlinks and 300K visits, because nobody bids on its queries. Authority and value are different things. We will show you what your traffic is worth before we ever propose work to grow it.
- We price your traffic honestly first
- Work aimed at queries that pay
- SEO and GEO delivered by one team
- Free consultation before any work
Check what your rivals quietly buy
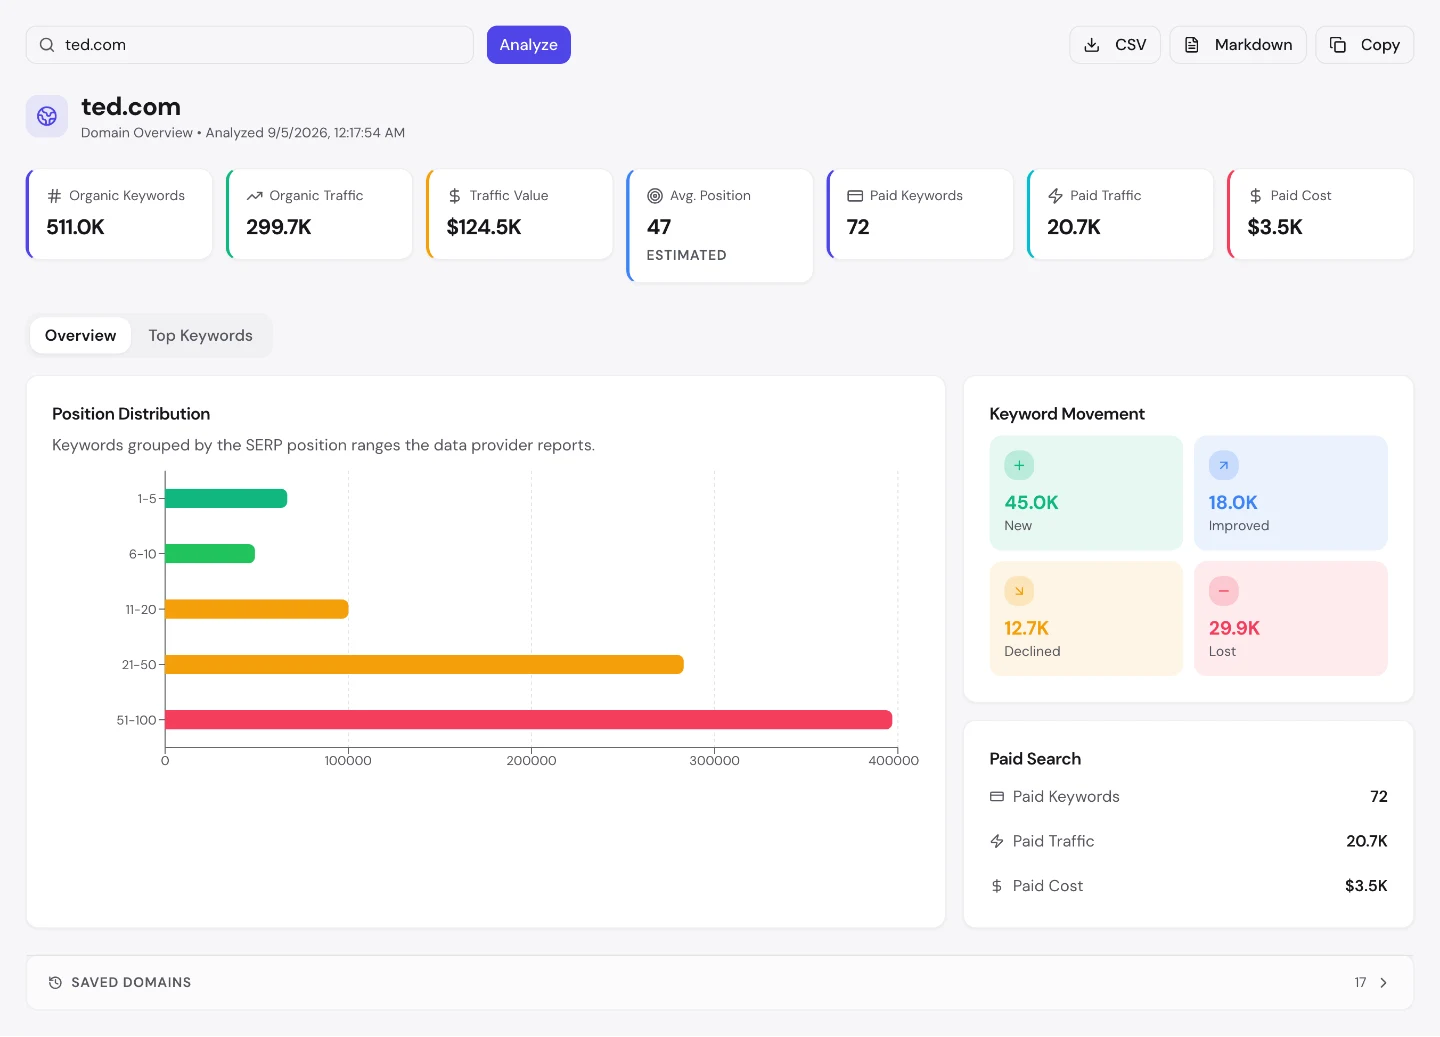
The paid columns are the surprise: 72 paid keywords and 21K paid visits in the period measured.
Every other site in these 3 batches is at or near zero. Meetup runs 8 paid keywords and $10. Eventbrite runs 163 for 83 visits. GOV.UK spends $3. TED buys 21K visits — roughly 7% of its organic total.
For a non-profit with 910K referring domains, that is a deliberate choice, and it says something useful: even a brand this strong finds it worth paying for placement on some queries.
The Domain Overview shows the paid columns for any domain.
So check your competitors there before you assume their visibility is all earned. Most of them are not buying. The ones that are will not tell you, and you will spend a year trying to match a number that came out of a budget.
Split brand traffic from discovery
Branded share: 59%.
Roughly 6 of every 10 visits are people who typed "ted talk" or something close to it. Strip those out and about 120K visits a month are genuine discovery.
That is against 510K ranking keywords sitting at an average position of 47.
That places TED between chess.com's 92% and Dribbble's 1% — a brand with real pull that still competes for a long tail it mostly ranks poorly for.
The 47 average is the number to sit with. TED ranks deep on most of what it is eligible for, and survives on the head terms its own name owns.
So split your own brand traffic out before you report a growth number. Otherwise a good PR quarter will look like an SEO win, and you will keep funding the wrong one.
Ask whether your catalogue expires
Keyword movement: 45K new keywords against 30K lost. Of the ones it kept, 18K improved and 13K declined — net up about 15K keywords, and positive on both pairs.
That makes TED one of only 4 sites across these 3 batches growing on both measures, alongside Healthline, Open Library and chess.com.
The archive is the reason. A talk from 2012 stays as relevant as it was, and the year-bucket pages around it keep accumulating rather than expiring — the same structural advantage Open Library has with books, and the opposite of Meetup's events or Eventbrite's dated listings.
If you are choosing what to build a catalogue out of, that property — does this expire? — matters more than volume. A Website Audit on one archive page will tell you whether the scaffolding is even indexable.
2 of TED's 3 biggest pages are subdomains, not the talks it is famous for. GOV.UK's biggest page is a weather forecast. Domain-level numbers hide this constantly. The Organic Traffic Checker returns the pages behind the total, with the share each one takes.
- The same report that found TED-Ed and a blog post outranking the talks
- Traffic share, top keyword and position for every page
- 3 checks a day, no signup, no card
What you cannot copy
And here is what I could not measure, or had to qualify. A couple of the tools I name below are partners of ours — if you buy through those links we earn a commission, and you do not pay a cent more.
I have no website audit for TED. The audit failed to return a result across 3 attempts, on both ted.com and www.ted.com, so unlike every other article in this series there is no technical score here. I would rather leave the section out than guess at one.
Our traffic figures are United States only and modelled from ranking positions and search volume rather than counted. TED's audience is global, so its worldwide traffic is far larger than 300K. The measurement also aggregates subdomains, which is why ed.ted.com and ideas.ted.com appear — I have reported that as a finding rather than filtering it out, but it means "TED's traffic" here is really the whole ted.com estate.
The keyword and backlink data underneath comes from SE Ranking, and the $120K traffic value is an ad-spend equivalent, not revenue. For a non-profit funded by conferences, licensing and donations, that figure says almost nothing about what the traffic is worth to TED.
The backlink total came from the app rather than the marketing tool, which was rate-limited (HTTP 429) at capture time. The app's BACKLINKS tile is a known defect on our side and has returned negative values on other domains, so the figure above is the page header total. The referring-domain and dofollow figures come from an earlier measurement, as does the sitemap census, crawled 29 August 2026. I did not run Keyword Research: it has an open defect returning implausible volumes.
And what you cannot copy: 40 years of a conference people wanted to attend. The 910K referring domains exist because TED talks were embedded, cited and argued about long before anyone optimised anything.
Frequently asked questions
How much is TED's search traffic worth?
Our Domain Overview prices it at $120K a month, against 510K ranking keywords at an average position of 47 and roughly 300K estimated US organic visits, measured 5 September 2026. That is the lowest value per backlink of the 15 sites in this series.
Why is TED's traffic value so low for its size?
Because advertisers do not bid on its queries. Traffic value estimates what the same visits would cost as ads, and "ted talk" carries almost no commercial CPC. Dribbble has a near-identical backlink count and earns 6 times more, because design queries do carry CPC.
Which TED pages get the most traffic?
The homepage leads at roughly 40K visits (13%), but 2 of the top 3 are subdomains: ed.ted.com at 15K and an ideas.ted.com article at 14K. The talks index is 4% and a "most popular" playlist 1%.
How much of TED's site is actually videos?
7% — 7,600 curated video URLs out of 120K total, counted in a full crawl on 29 August 2026. Most of the rest is year-bucketed archive pages, roughly 12.7 of them for every curated video.
How many backlinks does TED have?
105M backlinks, measured 5 September 2026. An earlier measurement recorded 910K referring domains at 96% dofollow — the second-highest referring-domain count in this series, behind Eventbrite.
Does TED run paid search?
Yes, and unusually for this series. It ran 72 paid keywords for about 21K paid visits in the period measured — roughly 7% of its organic total. Most sites measured here run almost none: Meetup 8 keywords, GOV.UK $3, Docker Hub 4 keywords and no measurable traffic.
Is TED gaining or losing keywords?
Gaining. It added 45K keywords and lost 30K, with 18K improved against 13K declined — positive on both pairs, up about 15K against a base of 510K. An archive of talks does not expire the way events or listings do.
What is TED's website audit score?
We do not have one. The audit failed to return a result across 3 attempts on both ted.com and www.ted.com, so no technical score is reported in this article. Every other site in this series has one.
The one number to take away
$120K.
That is what our tools price TED's monthly search traffic at, from 105M backlinks and 910K referring domains — a link profile in the top 3 of everything measured here, attached to the lowest traffic value in the set.
Read carelessly, that says TED is bad at SEO. It is not. It says traffic value measures advertiser demand, and nobody advertises against curiosity.
Which is the warning worth carrying out of this whole series: every metric in every tool, ours included, measures a proxy. Traffic value is a proxy for commercial intent. Domain trust is a proxy for who links to you. Average position is a proxy that collapses on a large catalogue. None of them is the business.
So pick the one metric that moves when your business does, and treat the rest as diagnostics.
Found something in your own report that surprised you, or measure this differently? I would genuinely like to know — the tools used are all free, so you can check every figure yourself. Measured 5 September 2026 unless stated. Domain Overview, Organic Traffic Checker and Backlink Analyzer figures are free runs of our own tools, all United States scope, and all modelled rather than counted where the tool says so. The sitemap census and referring-domain figures come from an earlier measurement, crawled 29 August 2026. No website audit was obtainable, and no revenue figure applies.