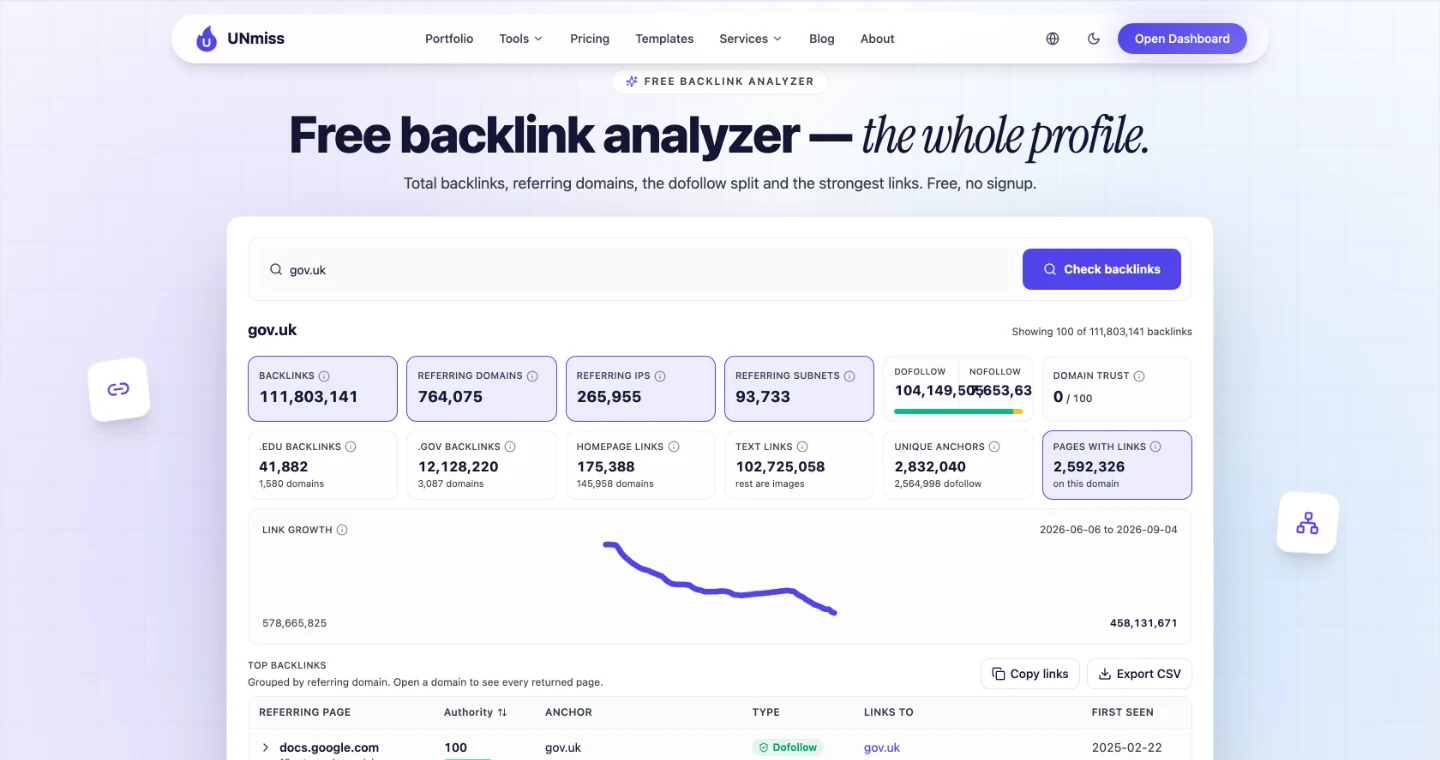
GOV.UK has 112M backlinks — the largest profile I have ever measured — and 12M of them come from other governments.
That is 760K referring domains behind $3.8M a month in free traffic.
I ran gov.uk through 4 of our tools alongside 9 other large sites, and it is an outlier on almost every axis. It is also, quietly, shrinking. Here are the 9 lessons you can use, including the one that surprised me most: 44% of everything it earns comes from a single subdomain about the weather.
Be the only correct source for a fact
Our Backlink Analyzer returns 112M backlinks from 760K referring domains, 93% dofollow.
A free run gives you the headline. For an estate this size you want the full keyword list broken down by section, and Semrush and SE Ranking will both hand you that in a form you can sort.
For scale, Eventbrite has the biggest commercial profile in these 2 batches and GOV.UK has well over twice as many links.
Nobody built this. There is no outreach team at the Cabinet Office. The links exist because when anything official needs citing — a form, a rule, a deadline, a statistic — there is exactly one correct URL, and everybody uses it.
Being the only correct source for a fact is worth more than being the best source for an opinion. The question for your own site is whether any fact you publish meets that description.
Usually one or two do, and nobody has ever framed them that way. Your pricing, your specification, your compatibility table, your API limits — if somebody else has to cite it accurately, you are already in the position GOV.UK is in, at a smaller scale.
Know that institutional links follow obligation
The detail that makes this profile unlike any other: 12M .gov backlinks from 3,100 government domains.
That is more total links than most large sites have of any kind. Healthline, an enormous site by any measure, has roughly 1,500 times fewer .gov links.
Governments link to governments. Councils cite national guidance, agencies cite each other, and foreign departments cite the UK's published rules. It is a closed, extremely high-trust graph no commercial site can enter.
The version you can use is smaller but real: institutional links follow obligation, not quality. If your content is something another organisation is required to reference — a standard, a schema, a compliance table, a definition — you get linked whether or not anyone enjoys reading it.
So look for the place in your industry where somebody has to point at a document. Then make sure the document they point at is yours, and that it never moves.
Check whether your report aggregates subdomains
Now the finding I did not expect.
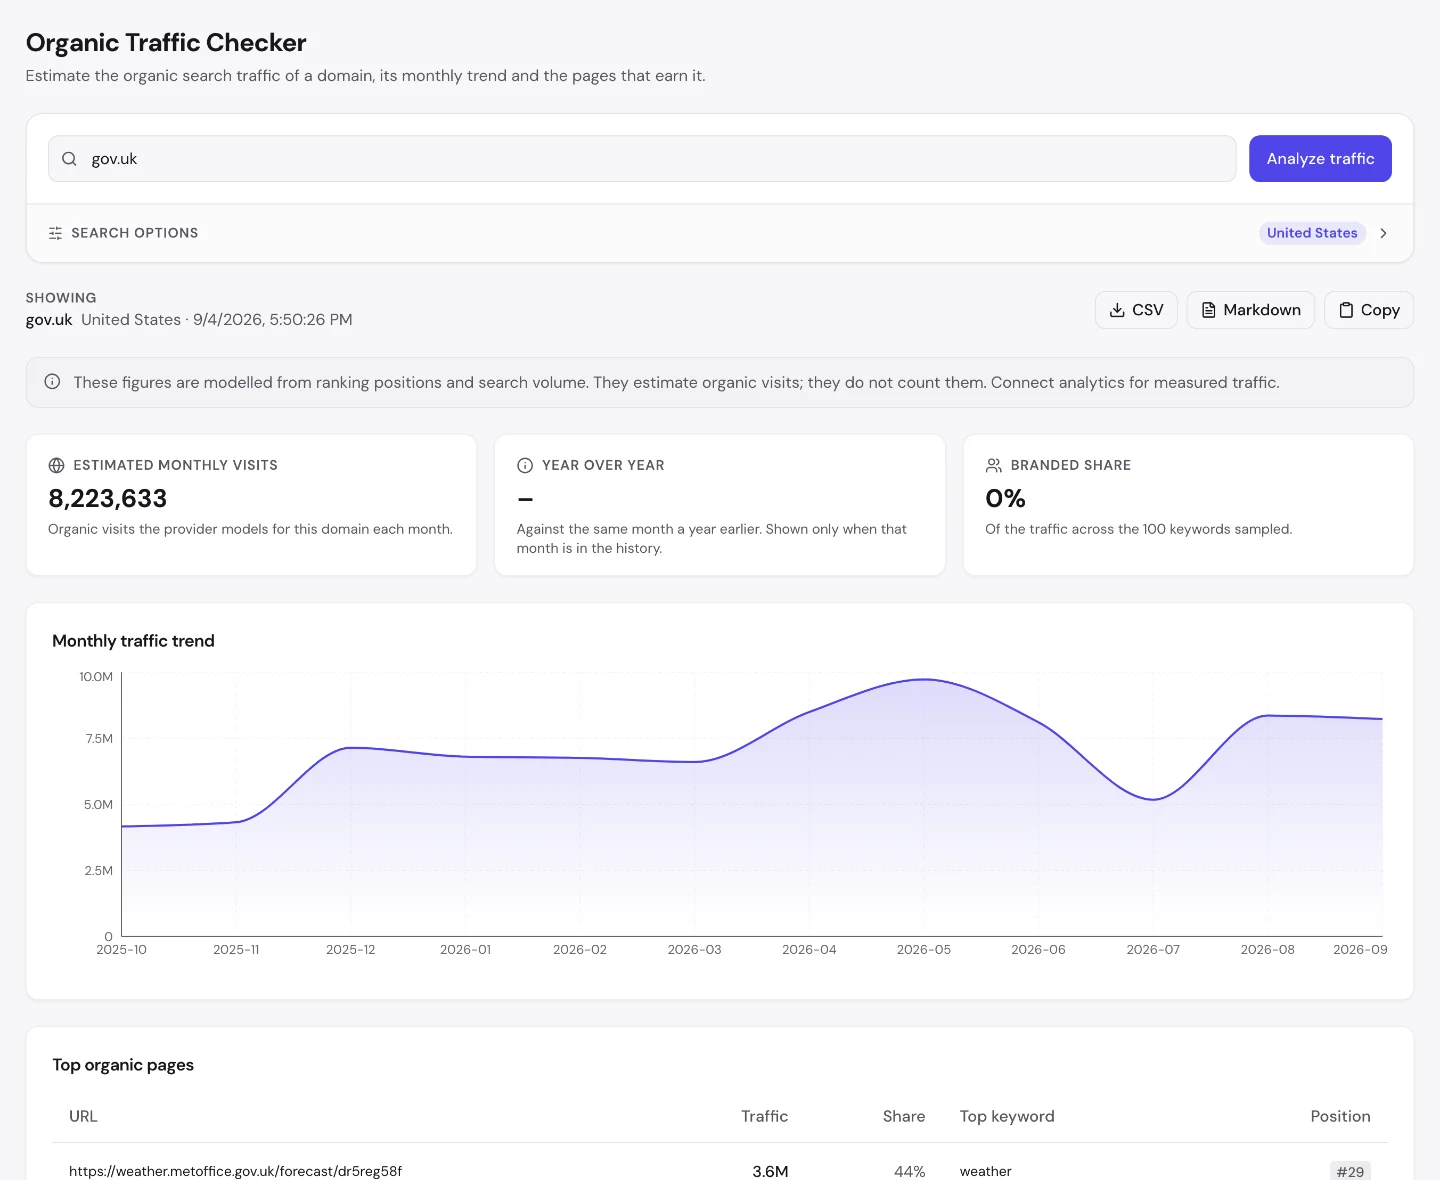
Measured at the gov.uk level, the Organic Traffic Checker puts total estimated visits at 8.2M — and a single Met Office forecast page takes 44% of them, ranking 29th for "weather".
Everything the government publishes about tax, benefits, passports, visas and law shares the rest, with the weather forecast winning outright.
Two things to take from it. First, ranking 29th on a query the size of "weather" beats first place on almost anything.
Second, and more practically: check whether your own traffic report is aggregating subdomains before you read another number off it. A subdomain doing something unrelated to your core product can dominate the total and hide what the rest of your estate is really doing.
You can be flat for 2 years on everything that matters and never see it, because one page nobody on your team owns is carrying the chart.
Cut every homepage line that is not a link
The Website Audit measures 816 words on the GOV.UK homepage, under a single H1.
Healthline's homepage runs well over a thousand. GeeksforGeeks' is shorter still, and that site has no H1 at all.
GOV.UK is the site the whole industry points at when arguing for writing less, and the number bears it out — but notice it is not the shortest here. The discipline is not brevity for its own sake; it is that every word is doing a navigational job. There is no positioning statement, no mission, no hero copy about transformation.
So try the test on your own homepage this afternoon. Delete every sentence that is not either a link or an instruction, and look at what survives.
Then check what the crawler actually receives with a Website Audit, and whether your H1 says what the page is for or what your company believes about itself.
Publish the record, not the pitch
This is the structural play, and it is where 13M keywords come from.
An earlier crawl of GOV.UK's own sitemaps found 510K URLs under /government/ alone — 59% of the estate: publications, news, statistics, speeches, consultations, tribunal decisions and internal tax manuals.
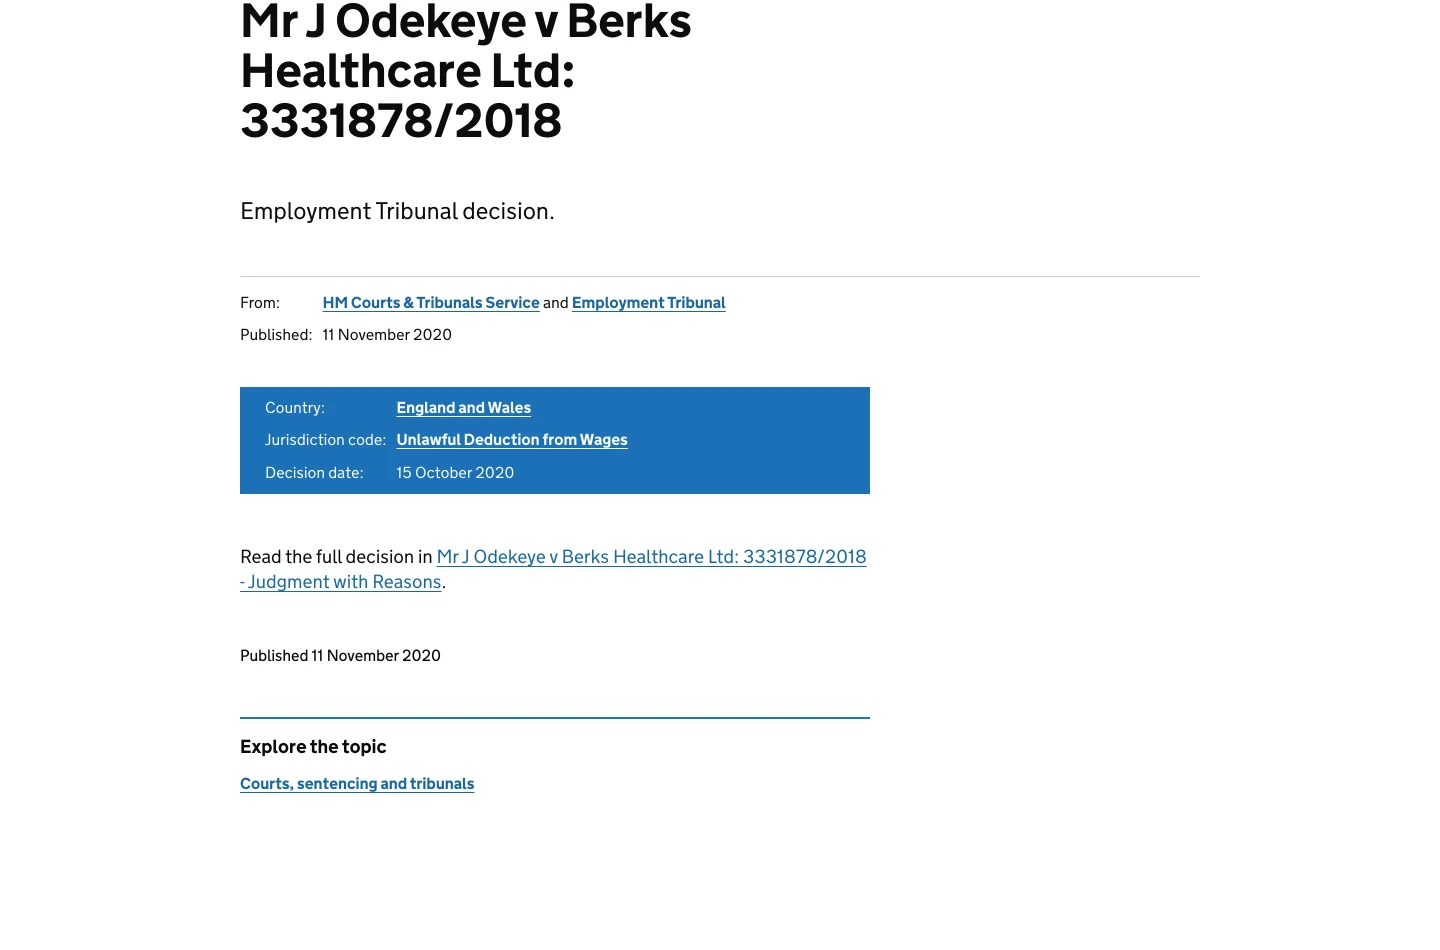
None of that was written to rank. It is the record of a state doing its job, published because publishing it is the job. And it produces a search footprint no content strategy could fund.
Almost every organisation has a version of this it throws away: changelogs, meeting minutes, methodology notes, decision records, historical pricing, past specifications.
Before you publish yours, check which parts anybody actually searches for with Keyword Research and group them with the Keyword Cluster tool.
Publishing the record is the cheapest content you will ever produce, because it already exists. Somebody in your company wrote it for another reason entirely, and the only cost left is deciding it is allowed to be public.
GOV.UK earns 8.2M visits with no brand searches at all, by publishing the record instead of the pitch. Almost every company throws away material that would do the same job. We help you find it and publish it well.
- We audit what you already have but hide
- Publishing systems built to scale
- SEO and GEO on the whole estate
- First consultation costs nothing
Watch your relevance, not just your links
From the Domain Overview: it improves far more keywords than it declines on, and still loses more than it gains.
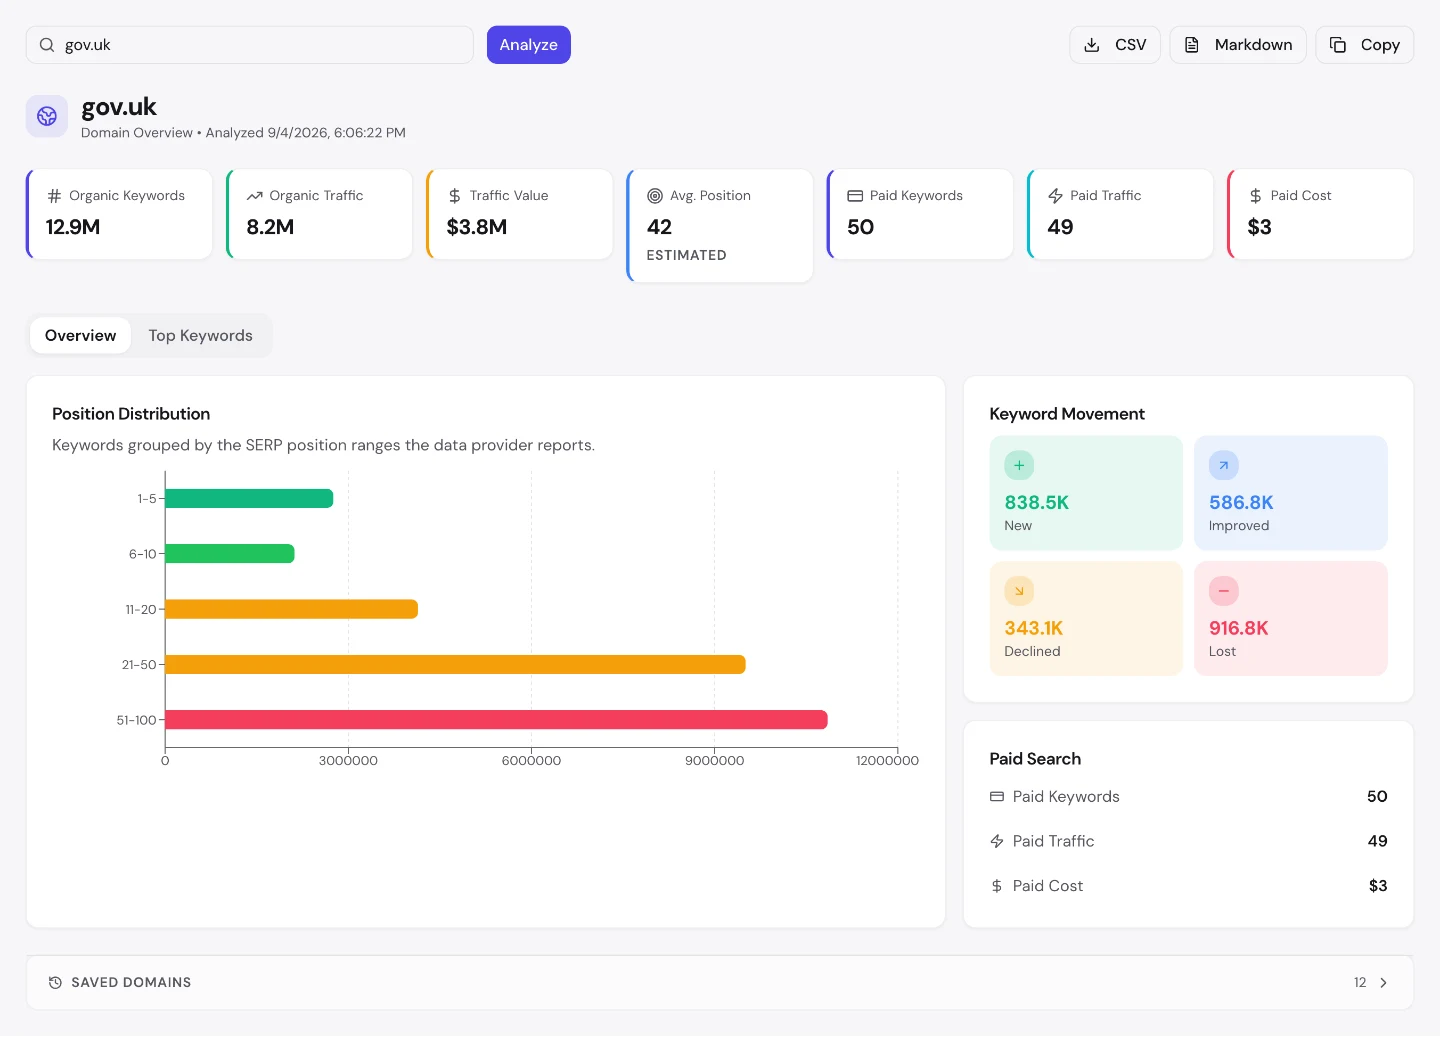
The existing library is strengthening. The library itself is shrinking.
That is what a public record does over time. Guidance is withdrawn, consultations close, schemes end, and the pages that described them stop matching any live query. The archive grows while its search surface contracts.
The largest link profile ever measured does not prevent it, which is the whole point: links protect your ability to compete, not your relevance. If the query stops existing, no amount of authority brings it back.
So watch both. Put the terms you actually care about in the Rank Tracker and you will see demand draining out of a topic long before your traffic chart admits it.
Read past the first row of your anchors
The anchor distribution: "GOV.UK" leads, but "Companies House" is second and within 30% of the entire parent brand. Then "Find a job in GB" and "Department of Education".
The top 4 anchors are the brand and 3 individual services.
People do not link to a government. They link to a thing they had to do. That is a useful correction to how most organisations read their own link profile: the brand anchor is usually vanity, and the service anchors tell you what you are actually known for.
So run your own anchor list in the Backlink Analyzer and read past the first row. What sits at 2 and 3 is your real product in the public's mind, whatever your homepage says it is.
If that surprises you, your positioning and your reputation have drifted apart, and the anchors are the more honest of the two.
Set a mobile target you can actually hit
The audit scores the homepage 86/100 with nothing critical outstanding. Google PageSpeed rates it 71 on mobile and considerably better on desktop.
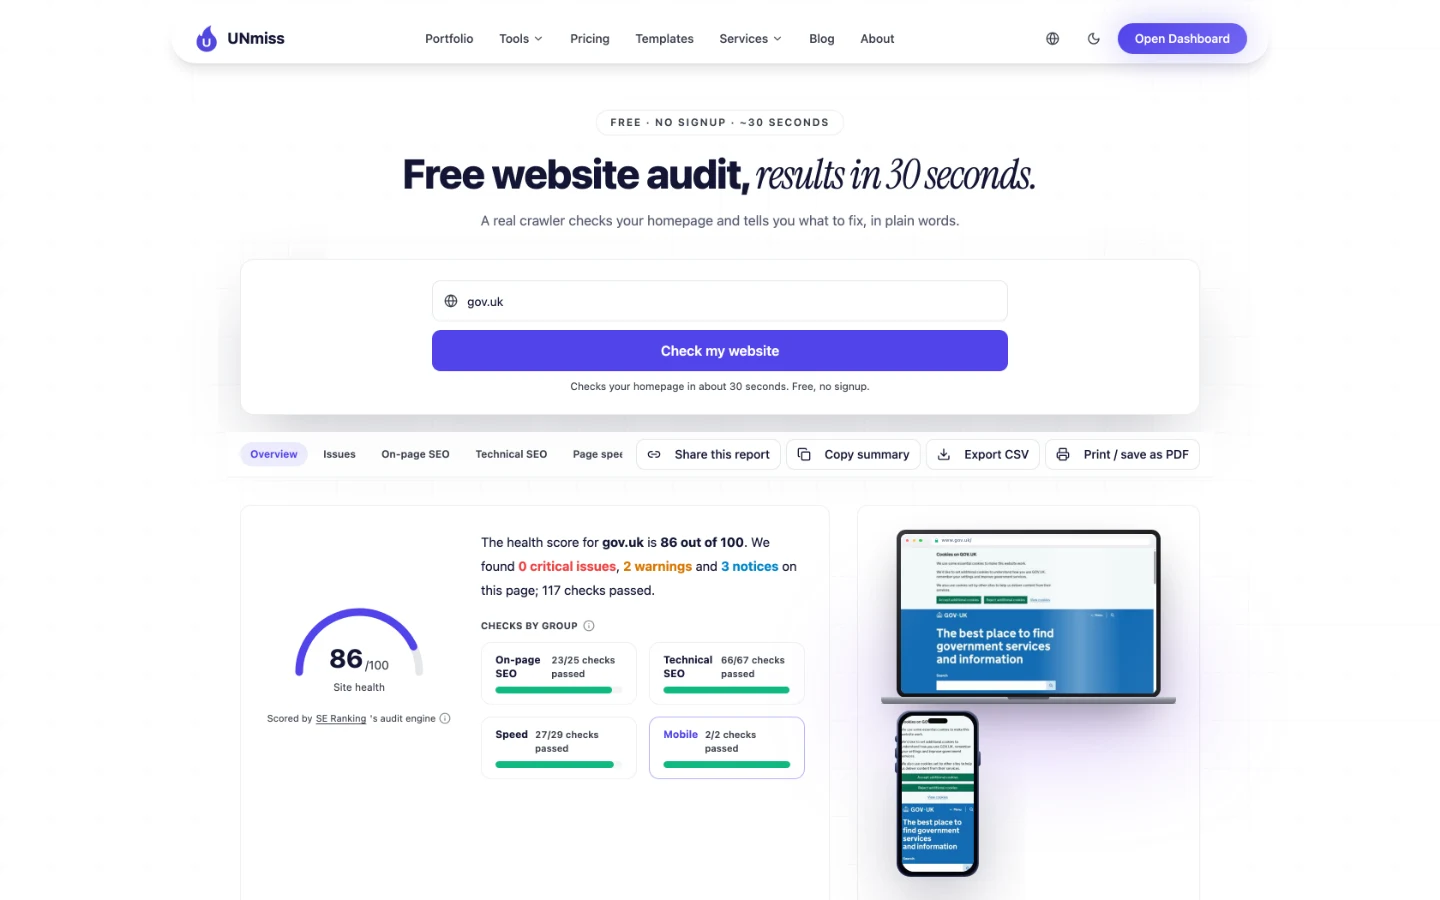
That is the highest passing-check count in these 2 batches, and a clean critical list on an estate this size is genuinely difficult. It is also the least surprising thing in this article — a site with statutory accessibility obligations is going to pass the technical checks.
The mobile score is the honest weak point, and it is exactly what MDN scored too.
If a government service department and Mozilla both land in the low 70s on mobile, treat that as the realistic ceiling for a content-heavy site rather than a failing grade. Measure your own with Site Speed before you commit to a number in front of anyone.
A target you cannot hit costs you a year of engineering and the credibility to ask for the next one.
Check the paid columns before you assume
Paid search: $3 in the period measured, against $3.8M of monthly organic traffic value.
In this batch only Eventbrite and MDN run meaningfully more, and neither is spending real money either.
Nothing to copy directly — a government has no acquisition budget to defend. But it is worth carrying into your next competitor review: check the paid columns before you assume a rival's visibility is bought.
Most of the time it is not, and the thing you are staring at is simply work somebody did earlier than you did.
44% of gov.uk's measured organic traffic is one weather subdomain doing something unrelated to the rest of the estate. The Organic Traffic Checker returns the top-pages table for any domain, with the share, top keyword and position beside each page.
- The same report that found one page taking 44% of a government's traffic
- Estimated monthly visits, branded share and the 12-month trend
- 3 checks a day, no signup, no card
What you cannot copy
And here is what I could not measure, or had to qualify. A couple of the tools I name below are partners of ours — if you buy through those links we earn a commission, and you do not pay a cent more.
Our traffic figures are United States only and modelled from ranking positions and search volume rather than counted. For a UK government site that is a real limitation: the US market is not where most of GOV.UK's audience is, so treat 8.2M as a sample of a much larger whole rather than the whole. The keyword and backlink data underneath comes from SE Ranking, and the $3.8M is an ad-spend equivalent, not revenue — GOV.UK sells nothing.
The measurement is at the gov.uk level and aggregates subdomains, which is why a Met Office forecast appears at all. I have reported that as a finding rather than filtering it out, but it means "GOV.UK's traffic" in this article is really "the gov.uk estate's traffic".
Two figures I left out. The report gave a Domain Trust of 0 out of 100 for a domain with the largest link profile we have measured, which is plainly wrong, so it is not cited. And the branded share came back as 0%, which I no longer trust after Rotten Tomatoes returned the same value while ranking first for its own brand.
The sitemap counts come from an earlier crawl of GOV.UK's own sitemaps, not from this run. It found 510K /government/ URLs, 130K tribunal decisions and 86K HMRC manual pages. I did not run Keyword Research: it has an open defect returning implausible volumes.
And what you cannot copy: statutory monopoly. GOV.UK is the only place a UK tax deadline officially exists, and that is a fact about the constitution, not about content. Copy the practice of publishing the record. Do not expect the link graph that comes with being the state.
Frequently asked questions
How many backlinks does GOV.UK have?
112M backlinks from 760K referring domains, measured 4 September 2026, across 94K referring subnets. The split is 104M dofollow to 7.7M nofollow, about 93% dofollow. It is the largest profile of the 10 sites measured across these 2 batches.
How many .gov links does GOV.UK have?
12M .gov backlinks from 3,100 domains, plus 42K .edu links from 1,600 domains. For comparison, Healthline — with 590K referring domains — carries 8,000 .gov links.
Which page gets GOV.UK the most search traffic?
A Met Office weather forecast page on a gov.uk subdomain, at roughly 3.6M estimated monthly visits — 44% of all measured organic traffic — ranking 29th for "weather". The next largest are the find-a-job service and the criminal record copy request, each around 2%.
How much is GOV.UK's search traffic worth?
Our Domain Overview prices it at $3.8M a month, against 13M ranking keywords at an average position of 42 and roughly 8.2M estimated US organic visits, measured 4 September 2026. That is an ad-spend equivalent rather than revenue.
Is GOV.UK gaining or losing keywords?
Losing, on balance. Over the measured period it gained 840K keywords and lost 920K — a net loss of about 78K against a base of 13M — while 590K improved and 340K declined. Withdrawn guidance and closed schemes retire their own queries.
What is GOV.UK's most common anchor text?
"GOV.UK" at 7.3M backlinks, followed closely by "Companies House" at 5.2M, then "Find a job in GB" at 2.8M and "Department of Education" at 1.7M. People link to the service they used rather than to the government.
What is GOV.UK's website audit score?
86 out of 100 on our Website Audit, with 0 critical issues, 2 warnings, 3 notices and 117 checks passed on the homepage — the highest passing-check count of the 10 sites in these 2 batches. Google PageSpeed rates the page 71 on mobile and 87 on desktop.
How many pages does GOV.UK publish?
An earlier crawl of its own sitemaps found 510K URLs under /government/ alone — 59% of the estate — including 280K publications and 120K news items, plus 130K employment tribunal decisions and 86K HMRC internal manual pages. Those counts were not re-verified in this run.
The one number to take away
12M.
That is how many of GOV.UK's backlinks come from other government domains, and it is the number that explains why this site cannot be competed with and should not be imitated.
Those links were not earned by writing well. They exist because a council, an agency or a foreign department had an obligation to point at the official version of something, and there is only one official version.
The usable half of that is smaller and worth having. Somewhere in your organisation there is a document other people are required to reference — a standard, a rate table, a specification, a definition, a compliance checklist. That document is worth more links than anything on your blog, and it is probably sitting in a PDF nobody has published as a page.
Go and find it.
Found something in your own report that surprised you, or measure this differently? I would genuinely like to know — the tools used are all free, so you can check every figure yourself. Measured 4 September 2026 unless stated. Domain Overview, Organic Traffic Checker, Website Audit and Backlink Analyzer figures are free runs of our own tools, all United States scope, and all modelled rather than counted where the tool says so. Sitemap counts come from an earlier crawl of GOV.UK's own sitemaps. No revenue figure applies.