GeeksforGeeks earns $2.8M a month in free traffic, and its biggest page explains Google Scholar.
Not a sorting algorithm. Not a data structure. A 2-minute explainer about a search engine for academic papers, pulling over 110K visits a month from position 22.
I ran geeksforgeeks.org through 4 of our own tools to find out what a computer-science site with 5.1M ranking keywords actually gets paid for. The answer was not computer science, and the 10 lessons below are all things you can test on your own site this afternoon.
Check which page actually feeds you
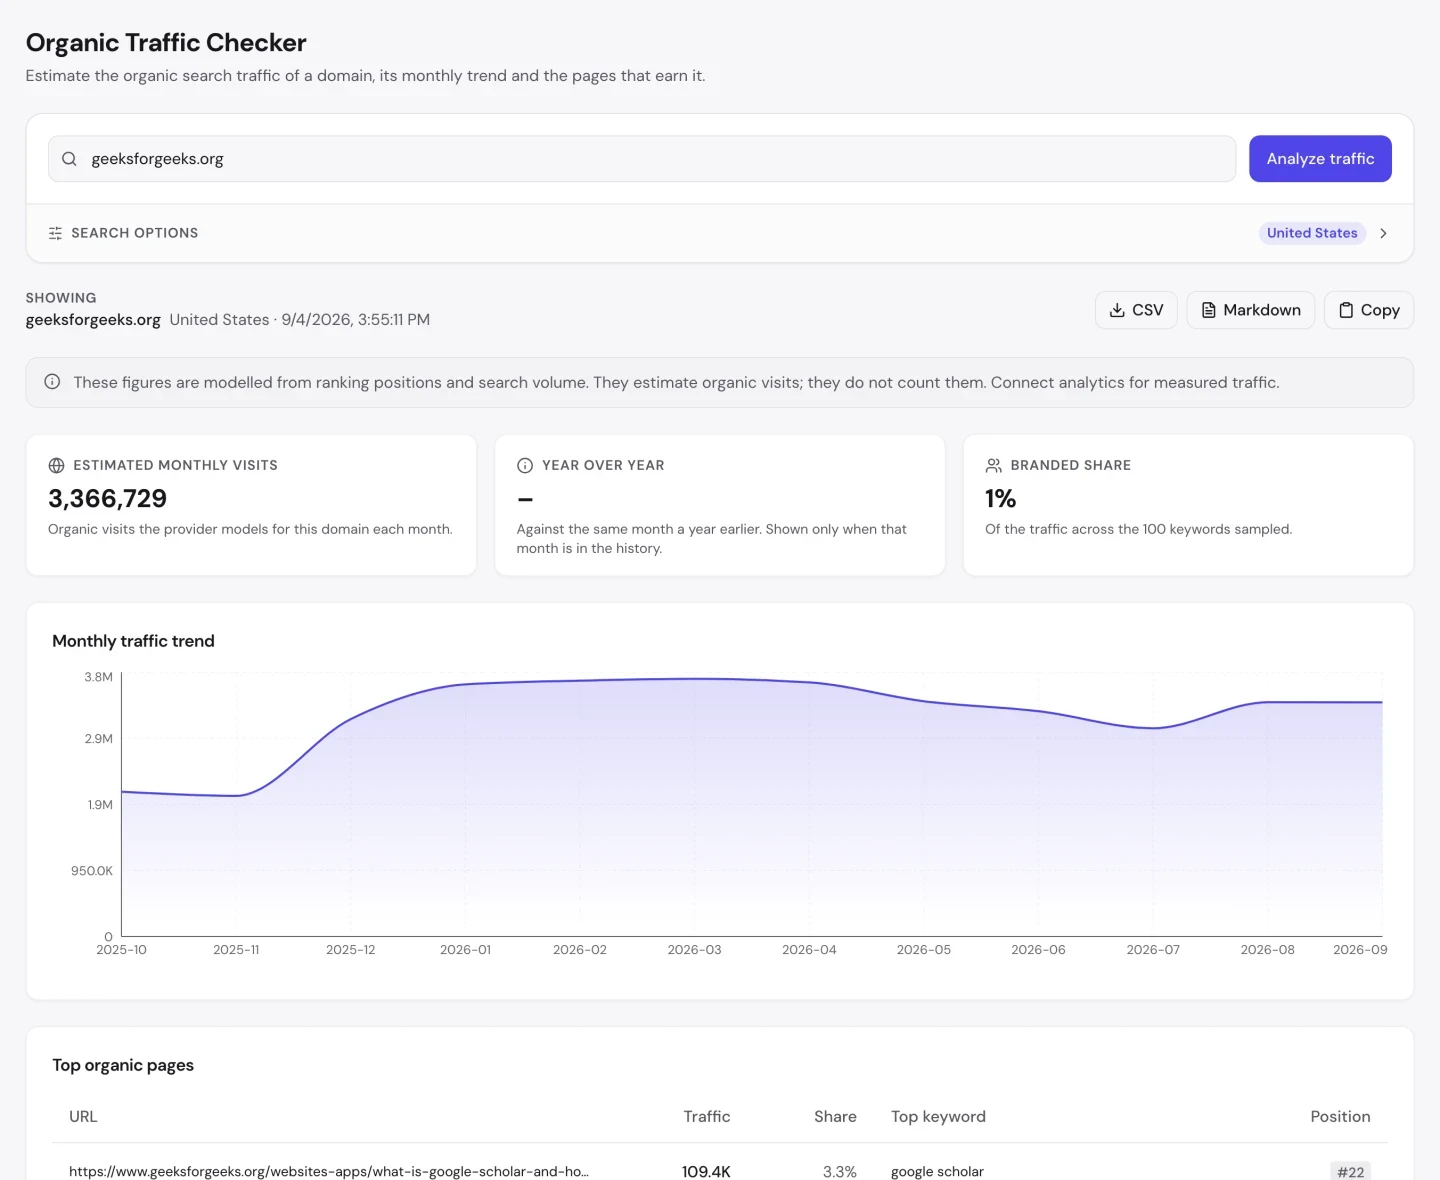
The Organic Traffic Checker returns a domain's top pages with the share each one earns, and that table is where this article started. GeeksforGeeks' number one page is What is Google Scholar and How to Use It — 3% of everything.
That is a free check on any domain. To find the utility hiding inside your own topic list, you want a full keyword export — Semrush and SE Ranking both give you one, and the gaps show up fast once it is in a spreadsheet.
Its second is What is an Email. Its fifth, and the first page about programming at all, is the C language reference.
You are probably assuming your best pages are the ones you meant to write. Run your own domain through that report before you assume it. The gap between the page you are proudest of and the page that actually feeds you is the most useful thing on this list, and most people have never looked.
4 of its top 10 convert units
Here is the table that made me stop and re-run the tool, because I did not believe it the first time.
A centimetre converter. An age calculator. A Fahrenheit formula. A coin flipper. Together those 4 pages pull 100K visits a month — more than the C reference, the HTML tables guide and the neural-network primer combined.
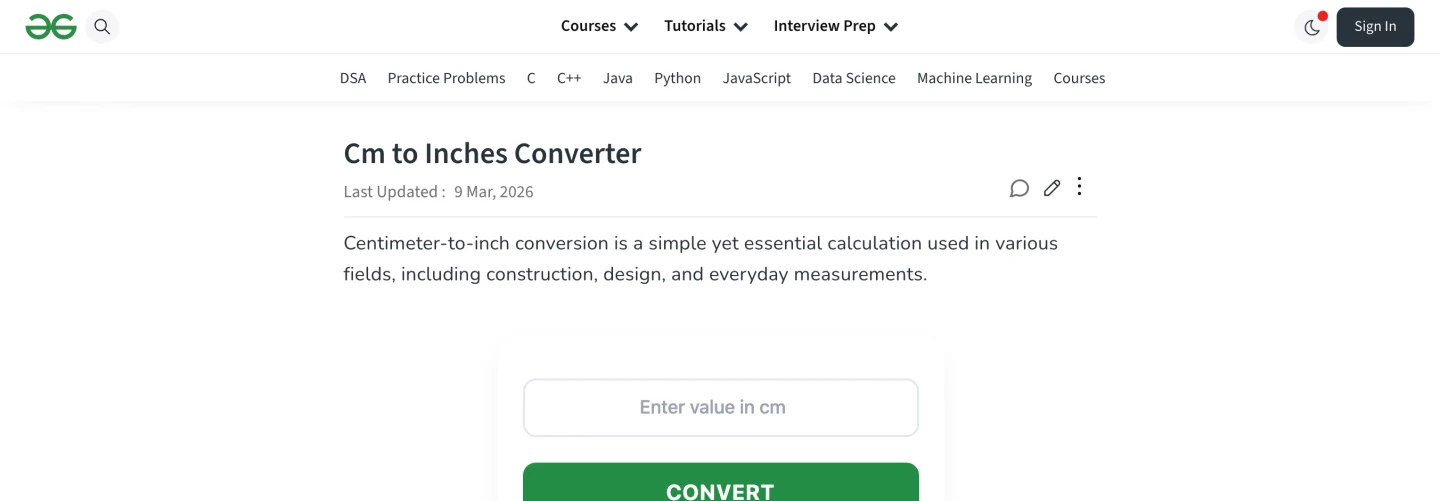
None of them teach anybody to program. All of them are things a student has open in another tab while they are learning to program, and GeeksforGeeks noticed.
Publish utilities beside your expertise
This is the play, and it is the cheapest one on this list to copy.
A utility page is a tool with a title. It needs no research, it never goes stale, it has no opinion to defend, and it answers a query that repeats forever. "cm to inches" does not get less popular next year. Nobody writes a better take on it. There is no content freshness treadmill.
Find the ones your audience already needs. Type your topic into Keyword Research and look specifically for the queries with a calculation, a conversion or a lookup in them — the ones that end in a number rather than an opinion. Then build the smallest possible page that answers it instantly, above the fold, without a preamble about the history of the metric system.
If you want the page to also rank as a page rather than only as a widget, run the draft through the Content Optimizer, which reads the top 10 results for the term and tells you what those pages cover that yours does not. A converter with 80 words of genuinely useful context beats a converter with none.
Know whether your traffic has a floor
The same report puts GeeksforGeeks' branded share at 1%.
Almost nobody types "geeksforgeeks". They type "cm to inches" and "convolutional neural network" and land there — 99% of a $2.8M-a-month estimate arriving with no relationship to the brand at all.
Read that as a warning as much as an achievement. A site living on 1% branded search has no floor. Every visit is rented from a ranking, and the ranking is rented from an algorithm. Compare it with your own number before you decide which side of that trade you are on — if your branded share is 40%, you have something GeeksforGeeks does not, even if your traffic is a hundredth of theirs.
Track what you rank 20th to 40th for
Look at the positions in that table again, because they are terrible.
Most of the top 10 sit past position 20. Only 2 rank first, and those 2 are the smallest entries in the list.
Page 3 of Google is supposed to be where traffic goes to die. It is not, if the query is big enough. "Email" at position 30 still pays 57K visits a month, because the number of people searching "email" is absurd.
The practical version for you: a modest position on a huge term can beat a first position on a small one, and you will never see that trade-off if you only track the keywords you already rank well for. Put the terms you rank 20th to 40th for into the Rank Tracker and watch them for a month. The ones that move are the ones worth a rewrite.
GeeksforGeeks writes about code, and its unit converters quietly bring in the traffic. Almost every business has a small tool like that sitting unbuilt. We find it, build it, and get it ranking.
- We audit your topics for tool-shaped demand
- We build the tool and the pages around it
- SEO, GEO and content in one package
- No retainer needed to start
Do not copy coverage at small scale
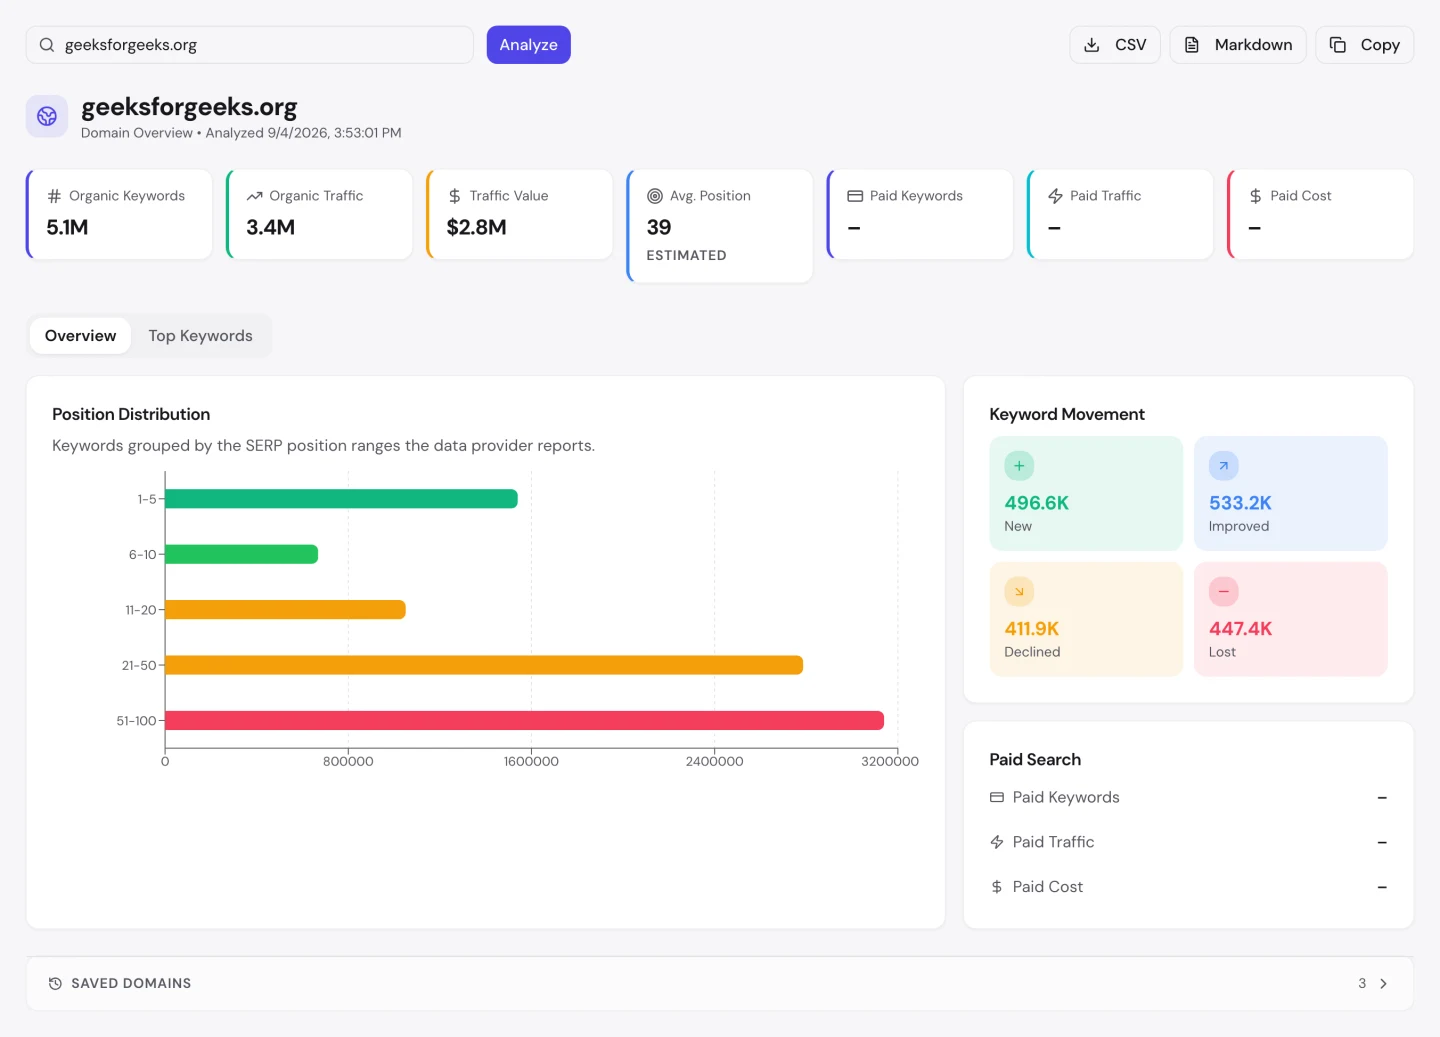
The Domain Overview's position distribution makes the same point across the whole site. The largest band by far is 51–100, which is why its average position sits at 39.
So this is not a ranking machine, it is a coverage machine: be present on an enormous number of queries and accept that most of that presence is deep in the results.
It works here because a huge number times a small number is still $2.8M. At 5,000 keywords the identical strategy earns you nothing.
That is the part people copying "publish everything" always miss, and it is the difference between this being a model and being a trap. Before you adopt it, work out how many pages you can realistically produce — if the answer is hundreds rather than millions, you want depth, not coverage.
Budget for refilling, not just building
Net, it is ahead — but only by about 1% on a base of 5.1M keywords. Nearly half a million fell out entirely.
That is the maintenance cost nobody puts in the case study. A library this size is not a finished asset, it is a leaking bucket that has to be refilled faster than it drains.
So if you publish at volume, budget for the refilling and not just the building. The plan that gets approved is always the one that ends when the pages ship, and it is always wrong.
Watch your lost column rather than your new one. It is the number that tells you whether you are growing or running.
Read your anchors, not your link count
Now the part that made me wince. I ran the profile through our Backlink Analyzer, which reports the anchor text distribution across all 2.5M+ backlinks.
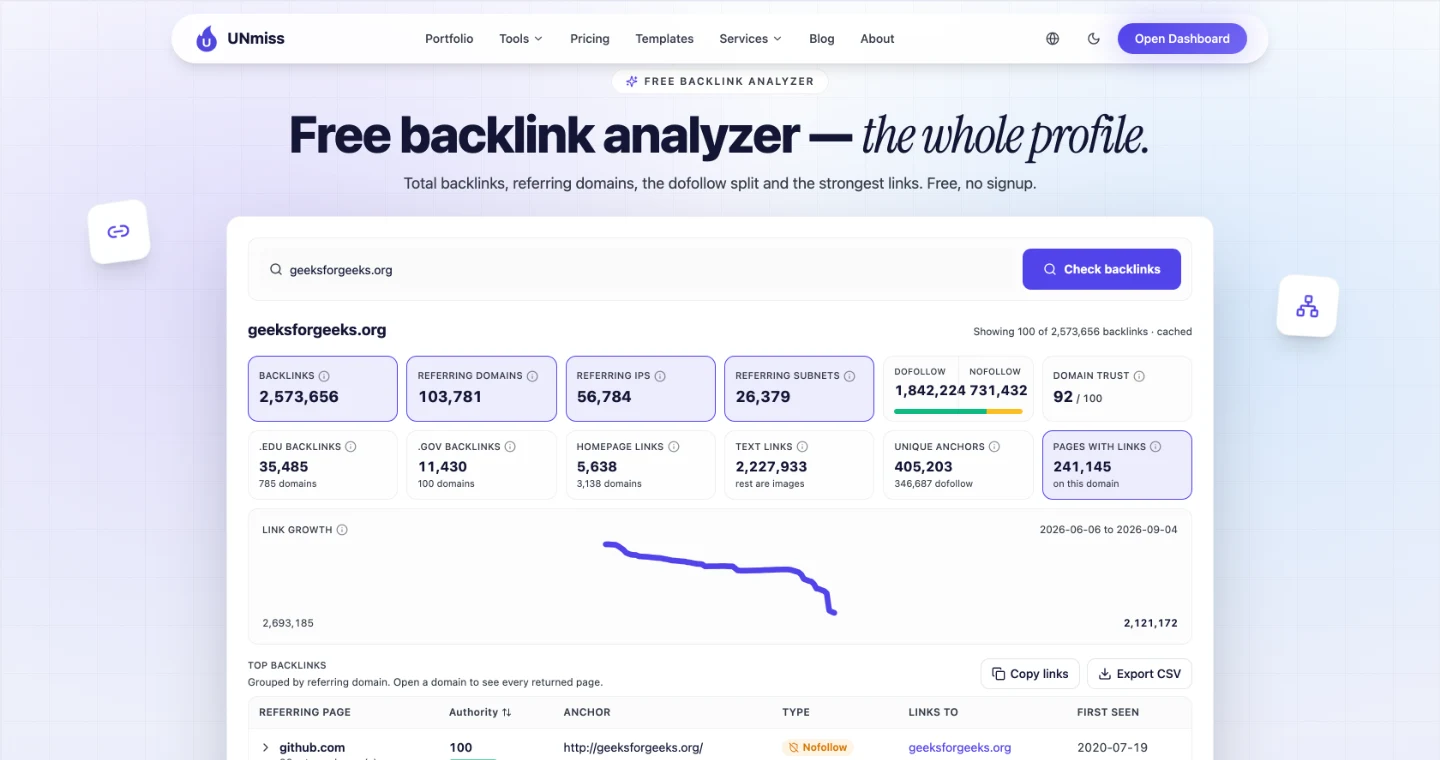
The most common anchor is the brand name. The second and third are TELEGRAM @SEO_ANOMAL… and TG @BHS_LINKS - BEST SE….
Two link-spam channels account for 9% of the entire profile — more than every legitimate non-brand anchor put together. And the link growth chart points downward across the summer.
GeeksforGeeks is fine, because at that scale the spam is noise. You are not fine, because at 3,000 links the same absolute volume of junk would be your whole profile.
So check your anchor distribution rather than your link count, and do it this week. A profile can grow and rot at the same time, and the count will look perfectly healthy the entire time it is happening to you.
Be the obvious thing to link to
The better half of the same report: 35K .edu backlinks from 785 domains, at Domain Trust 92.
Nobody sold those. University course pages link to a data-structures explainer because it is the clearest free thing to point a first-year at. That is what publishing at this depth actually buys — not the traffic, which the utilities carry, but the citations.
Here is your version, and it is 5 pages rather than 5 million. Pick the 5 topics in your field that somebody has to explain to a beginner every single year, and write the best free explanation of each.
Reference-grade pages earn links while you sleep, and no outreach campaign you can buy matches the conversion rate of simply being the obvious thing to link to.
Check the basics you assume are fine
I ran the homepage through our Website Audit expecting a formality, and got a genuine surprise.
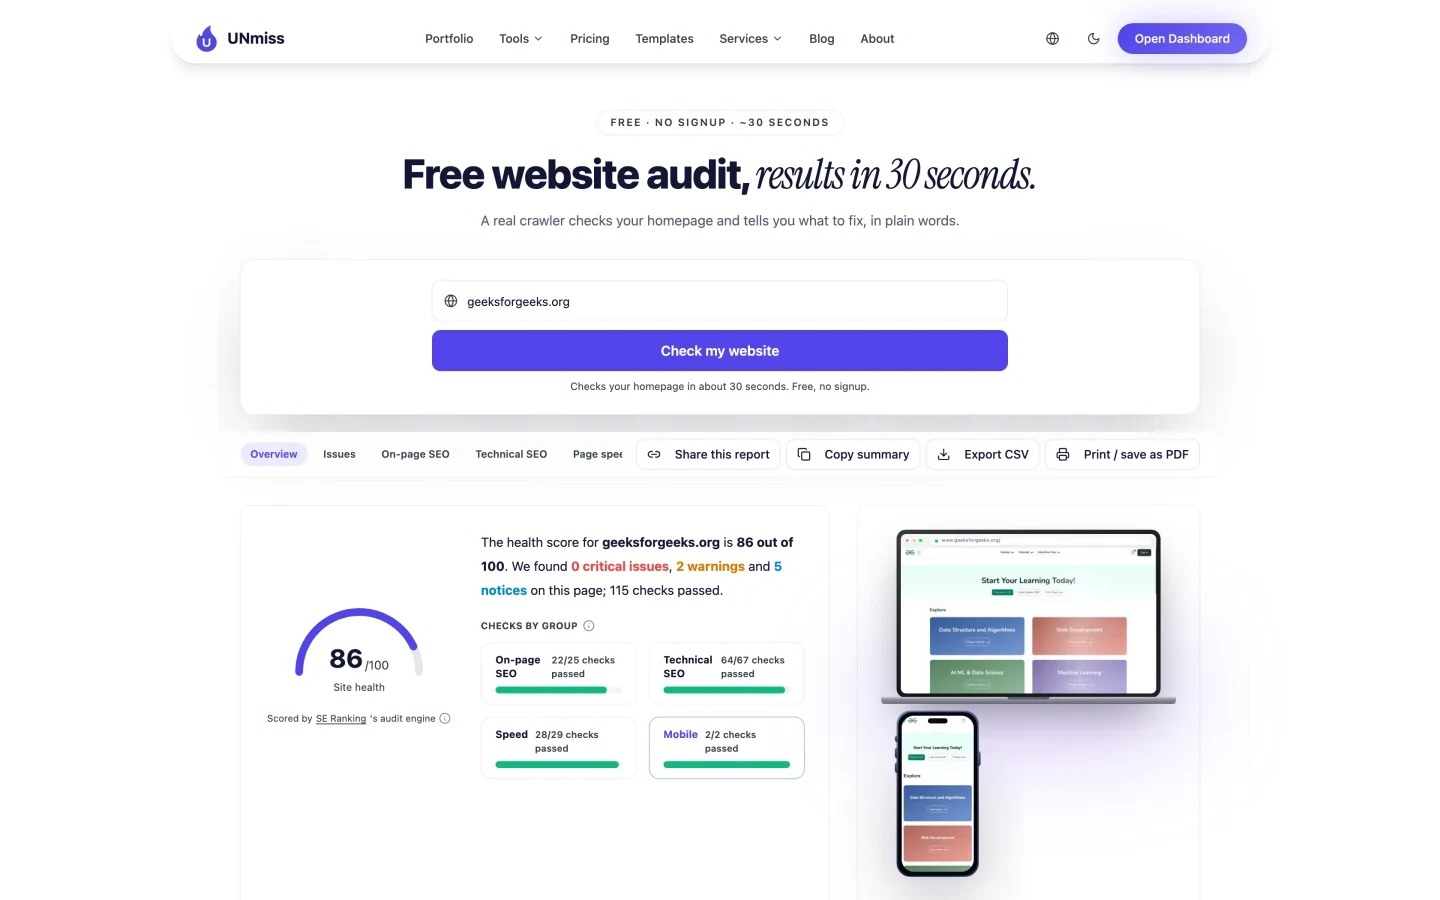
86/100, nothing critical. And then: no sitemap.xml at all, and no usable H1 on the homepage, for a site with 5.1M ranking keywords.
Google finds the pages anyway — internal linking at that density does the job. But it is the least defensible thing on the site and it costs nothing to fix.
Which is your prompt to check the two or three basics you have assumed were fine for years. Nobody audits their own sitemap, because everybody remembers setting one up once.
The XML Sitemap Generator crawls your site and builds the file you should have, the Headline Analyzer tells you whether your H1 says anything, and the Meta Tag Generator fixes the run-on description this audit also flagged.
Weigh your ad stack against your speed
The audit's PageSpeed numbers are poor: 49 out of 100 on mobile, and not much better on desktop.
The server is not the problem — first byte lands in 134ms and the crawler had the page in 0.2s. What costs 51 points is everything layered on top, on a site monetising 3.4M visits a month with ads.
This is the honest trade GeeksforGeeks has made, and it is worth naming rather than admiring: the traffic pays for the ads, the ads cost the mobile experience, and the mobile experience is where most of that traffic actually reads. Before you copy the model, run Site Speed on your own worst page and decide what you are willing to trade.
The finding that made this article was one table: the pages that actually earn the traffic, and the share each one takes. The Organic Traffic Checker returns it for any domain, with the top keyword and position beside every page. It takes about thirty seconds.
- The same report that found 4 unit converters in GeeksforGeeks' top 10
- Estimated monthly visits, branded share and the 12-month trend
- 3 checks a day, no signup, no card
What you cannot copy
And here is what I could not measure, or had to qualify. A couple of the tools I name below are partners of ours — if you buy through those links we earn a commission, and you do not pay a cent more.
Our figures are United States only, and they are modelled from ranking positions and search volume rather than counted. The tool says so on its own screen. GeeksforGeeks' global traffic is larger than the 3.4M here; Semrush and Similarweb publish global estimates, and I have not re-verified theirs. The year-over-year comparison came back empty because that month is not in the retained history, so I have no trend claim to make.
The keyword and backlink data underneath these reports comes from SE Ranking. The $2.8M traffic value is a model on top of a model — it prices what the same visits would cost as ads at the CPCs those keywords carry. It is not revenue, and no revenue figure for GeeksforGeeks was available to me.
I did not re-count the article total. The commonly cited figures come from the site's own navigation, not from this run. It recorded roughly 180K articles across 450 categories.
And the thing you genuinely cannot copy: 15 years. The .edu links, the 5.1M keywords and the internal linking density that makes a missing sitemap survivable are all compound interest on a decade and a half of publishing. You can copy the utility-page play this week. You cannot copy the position that makes it worth $2.8M.
Frequently asked questions
How much is GeeksforGeeks' traffic worth?
Our Domain Overview prices it at $2.8M a month, against 3.4M US organic visits from 5.1M ranking keywords, measured 4 September 2026. That is a modelled figure: it estimates what the same traffic would cost to buy through ads at the CPCs those keywords carry. It is not GeeksforGeeks' revenue, and no revenue figure was available to us.
What is GeeksforGeeks' most visited page?
An explainer titled "What is Google Scholar and How to Use It", at 110K estimated visits a month — 3% of the site's organic traffic — ranking at position 22 for "google scholar". The second is "What is an Email" at 57K, ranking 30th.
How many backlinks does GeeksforGeeks have?
2.6M backlinks from 100K referring domains, measured 4 September 2026. The split is 1.8M dofollow to 730K nofollow, or 72% to 28%, across 26K referring subnets. Domain Trust is 92 out of 100.
How many .edu links does GeeksforGeeks have?
35K .edu backlinks from 785 distinct domains, plus 11K .gov backlinks from 100 domains. These are the citations that come from being the clearest free explanation of a topic rather than from outreach.
Is GeeksforGeeks' backlink profile spammy?
Partly. The 2nd and 3rd most common anchor texts are Telegram link-spam channels, accounting for 220K backlinks between them — 9% of the profile. At 2.5M links from 100K domains that is survivable noise. On a small site the same absolute volume would dominate the profile.
What is GeeksforGeeks' branded search share?
1% of traffic across the 100 keywords sampled by our Organic Traffic Checker. Essentially all of its traffic arrives on unbranded queries such as "cm to inches" and "convolutional neural network" rather than on the brand name.
What is GeeksforGeeks' website audit score?
86 out of 100 on our Website Audit, with 0 critical issues, 2 warnings, 5 notices and 115 checks passed on the homepage. The notable failures are no sitemap.xml at the standard path, no usable H1 on the homepage, a 190-character meta description and missing social preview tags. Google PageSpeed scores the homepage 49 on mobile and 61 on desktop.
Where do most of GeeksforGeeks' keywords rank?
Below position 20. The largest band in the position distribution is 51–100 at roughly 3.2M keywords, followed by 21–50. Positions 1–5 hold about 1.5M and 6–10 the smallest share. The average position across all 5.1M keywords is 39.
The one number to take away
1%.
That is GeeksforGeeks' branded share, and it is the number that explains the other nine lessons. A site where 99 of every 100 visits arrive on an unbranded query has to be present on an enormous number of queries, has to accept position 30 as a normal outcome, and has to keep publishing to replace the 450K keywords it loses.
It also has to take the traffic wherever it appears — including on a page that converts centimetres to inches.
So run the top-pages report on your own domain, and look at the 4 pages you did not expect. That is where your version of this is hiding. If your branded share comes back high, you are playing a different game than GeeksforGeeks and should not copy any of this. If it comes back at 1%, you are playing exactly their game, and every lesson above applies to you.
Found something in your own report that surprised you, or measure this differently? I would genuinely like to know — the tools used are all free, so you can check every figure yourself. Measured 4 September 2026. Domain Overview, Organic Traffic Checker, Website Audit and Backlink Analyzer figures are free runs of our own tools, all United States scope, and all modelled rather than counted where the tool says so. Article and category counts come from GeeksforGeeks' own navigation and were not re-counted in this run. No revenue figure for GeeksforGeeks was available to us.