freeCodeCamp teaches people to code, and its biggest article after the homepage is a list of emoji to copy and paste.
10K visits a month, ranking 26th for "emoji". Then Google Maps pins, a random number generator, and a table of alt codes.
Not one of its top 5 pages is about programming. I ran freecodecamp.org through 4 of our tools, and this is the second site in the series where a technical education platform is funded by search traffic that has nothing to do with its subject. Here are the 8 lessons.
Your audience searches the blocker, not the subject
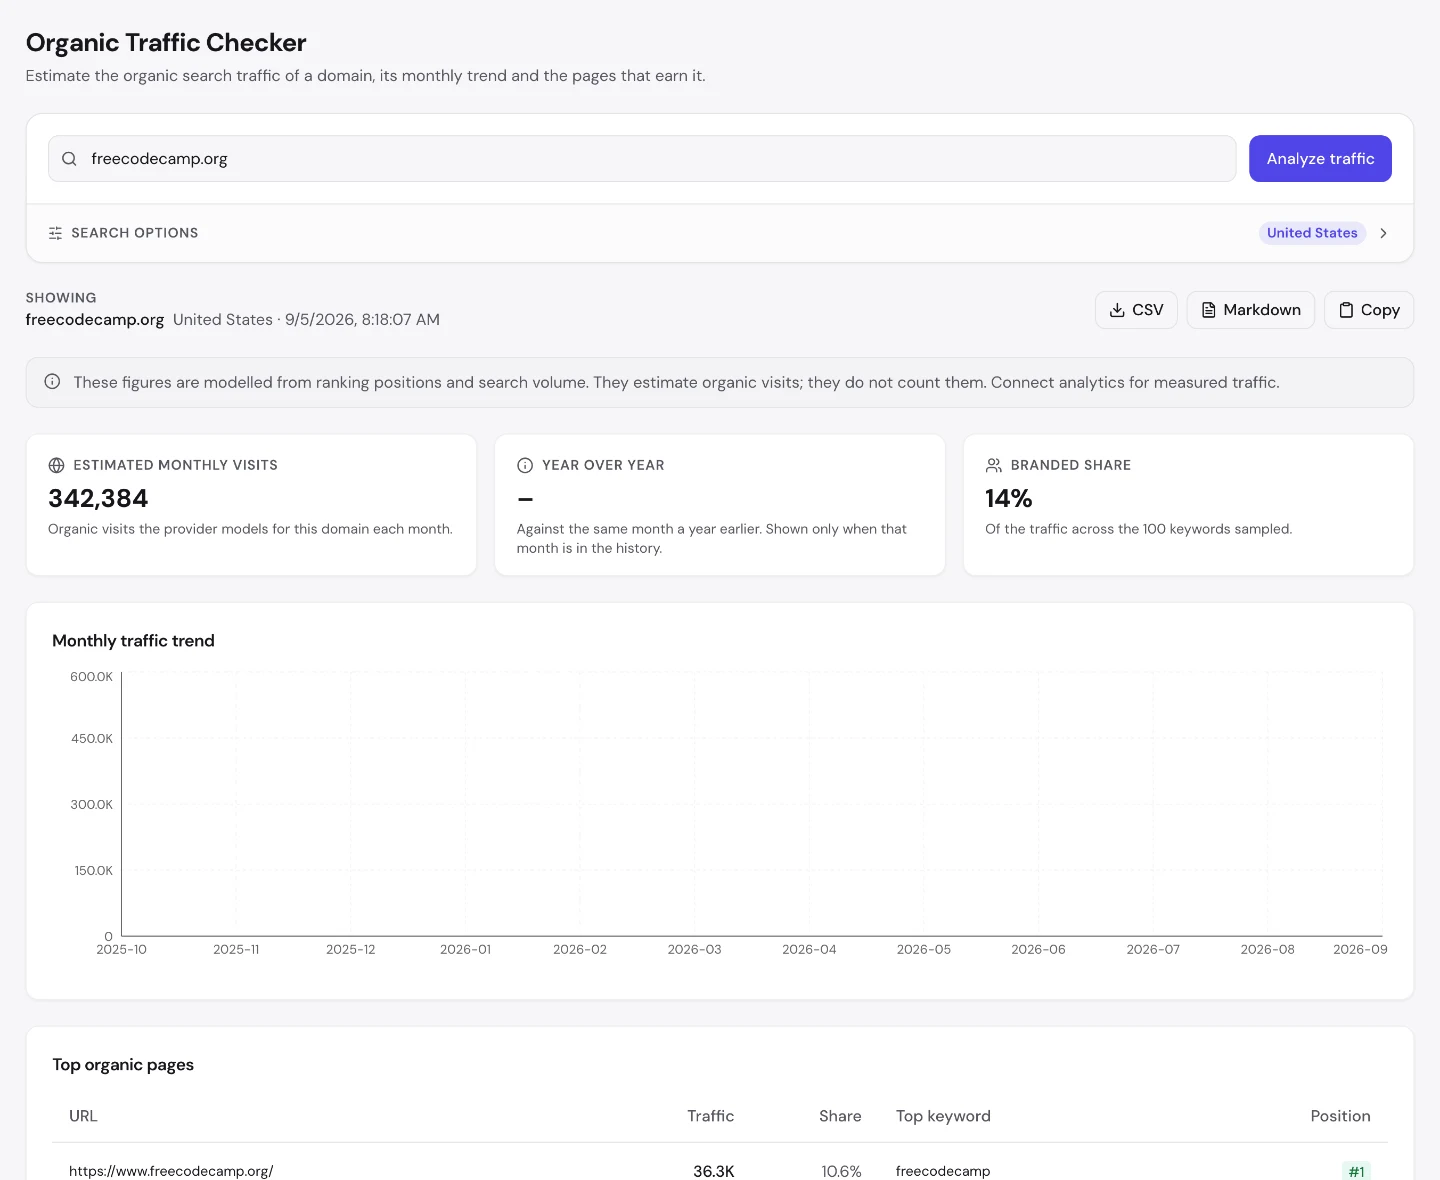
The Organic Traffic Checker puts freeCodeCamp at about 340K estimated monthly visits, with the homepage taking a tenth. Then:
An emoji list, ranking 26th. A guide to dropping pins in Google Maps. A random number generator, ranking 10th. A table of alt codes.
Free, and enough to spot the pattern. Finding your own version of this takes a proper keyword database, and Semrush and SE Ranking both have one deep enough to surface the odd little queries nobody thinks to check.
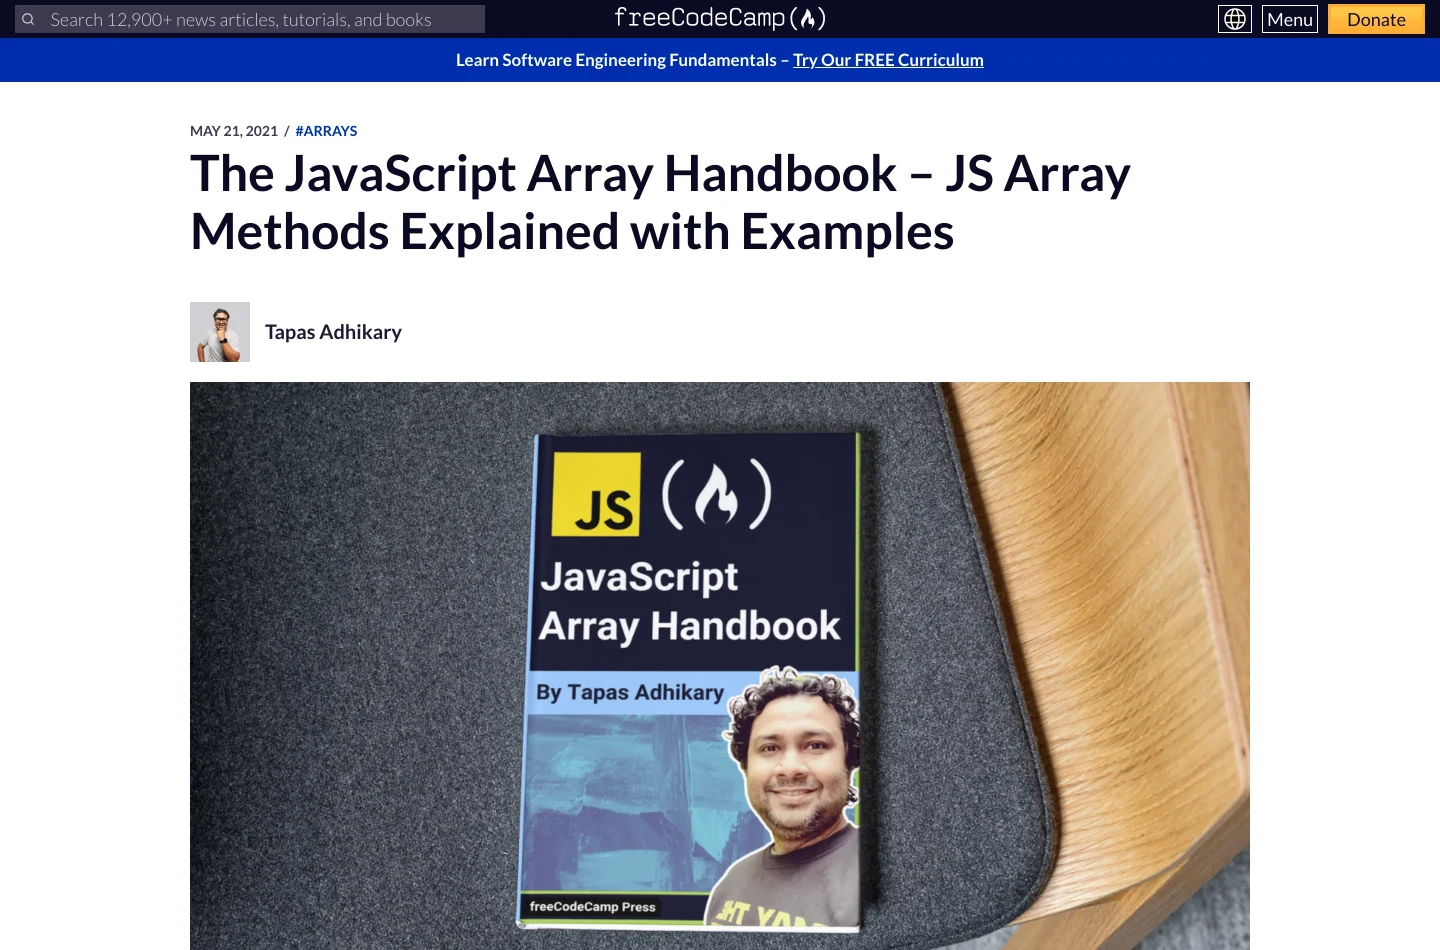
GeeksforGeeks does exactly this — 4 of its top 10 are unit converters and a coin flipper. Two of the largest programming education sites on the web are both carried by utility pages a beginner has open in another tab.
That is not an accident twice. It is what happens when your audience is people learning at a computer: they search for the small thing blocking them right now, not for the subject they are studying.
So ask what interrupts your own audience mid-task. Not what they want to learn from you — what they stop and look up in another tab while using your product or studying your subject. That list is almost certainly not on your content calendar, and it is where these two sites get their traffic.
Write the utility, keep the audience
The copyable version, and it is cheap.
These pages need no research and never expire. "Alt codes" will be searched at the same rate in 5 years. They cost you nothing in credibility either — a coding school publishing a copy-paste emoji table is being useful, not off-brand, and you should stop worrying that yours would look unserious.
Find the ones adjacent to your subject: the conversion, the lookup, the reference table, the generator. Put your candidates into Keyword Research and look for queries that describe a task rather than a topic.
Then group them with the Keyword Cluster tool so you ship a family rather than a scattering — one good utility page is a curiosity, ten related ones are a section.
And put the answer at the top. If your random number generator opens with 400 words about randomness, nobody scrolls, and you have built the thing without getting the benefit.
Read what your sitemap actually contains
An earlier full crawl found something unusual: freeCodeCamp declares 16K URLs and every single one sits under /news/.
The curriculum — the actual product, the thing people sign up for — is not in the sitemap at all. The search-visible site is the English blog by itself.
Go and read what your own sitemap actually contains, not what you assume it does. It takes 2 minutes and it is not the check anyone runs.
It is remarkably common for the product to be excluded and the blog to be the entire declared surface — usually because two different systems generate them and nobody owns the join. If that describes you, you have been reporting on a site Google is only seeing half of.
Name the query each page type wins
Just under a fifth of those URLs are not articles: 2,600 tag pages and 575 author pages.
Tag pages have earned their place right across this series — itch.io, Eventbrite, Dribbble and Open Library are all carried by their aggregation layer. Author pages are a different bet, and it is the one PyPI lost with user profiles.
So apply the test that keeps recurring, out loud, to every page type you generate: name the query it wins.
For a tag, you can answer immediately. For an author nobody has heard of, there is no answer — and if you cannot produce one for a page type in your own plan, you are about to publish several hundred pages that were never eligible to rank.
freeCodeCamp ranks first for an emoji because it answered the thing that was blocking people. Your customers get stuck on small things too, and those searches are cheap to win if you know which ones they are.
- We map what blocks your buyers before they buy
- Content and small tools that answer it
- Full SEO and GEO delivery, not advice
- First consultation is free
Prune the archive nobody has opened
Now the maintenance problem. 4,200 articles carry a Medium-style ID in the slug — the fingerprint of a migration years ago — and 98% of them have not been touched since 2019.
So roughly a third of the corpus is frozen technical content from 2018 and 2019, in a field where a 7-year-old tutorial is often actively wrong.
If you have an archive like that, the decision is not "rewrite everything" — that is why nobody ever starts.
Pull the list of pages still earning traffic and fix those, because they are few and they are the ones being read. Then decide honestly whether the rest should be noindexed rather than left standing as your work. An old page nobody maintains still has your name on it.
Check your anchors for other languages
Our Backlink Analyzer reports 79K referring domains at Domain Trust 93 — and one anchor dominates everything.
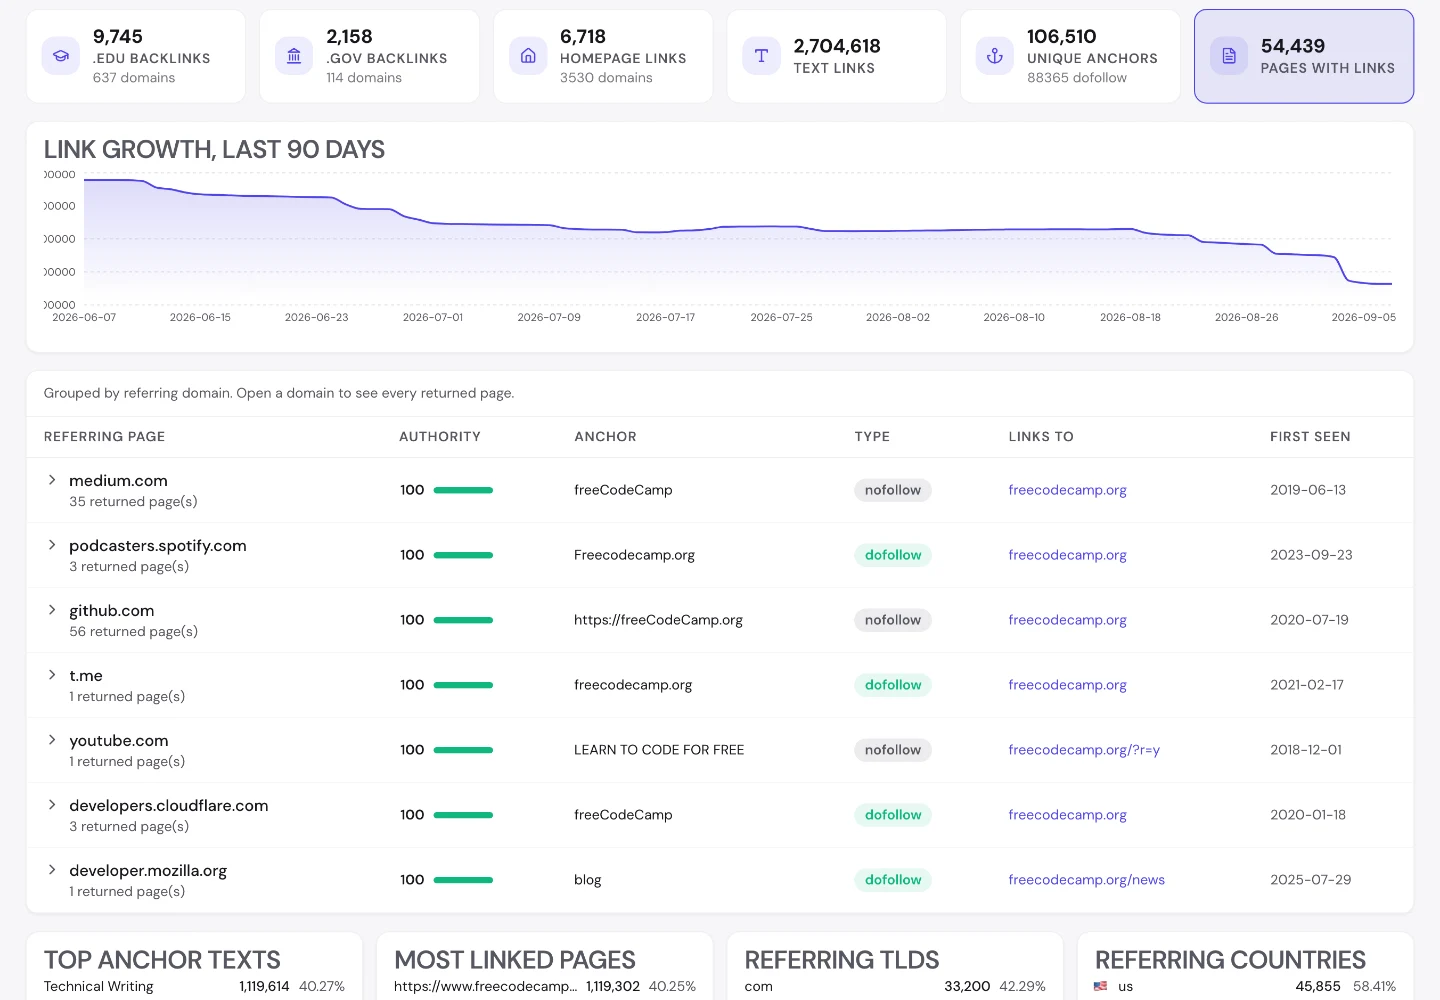
"Technical Writing" carries 40% of the entire profile. Second is FCC网站 at 16% — the Chinese name for the site. Third is a bare URL to a single article.
This is the fourth site in the series with a non-English anchor in its top 3, after Rotten Tomatoes, MDN and Open Library. Reference material gets cited in languages its authors do not write in, every time.
So go and read your own anchor list, past the first few rows. If a language you do not publish in shows up, you have an audience nobody in your company has met.
That is worth knowing before you commission a translation, and worth knowing instead of one — the demand is already there and it will tell you which market to serve first.
Stop treating the audit score as a KPI
The Website Audit scores the homepage 74/100, with 1 critical issue outstanding.
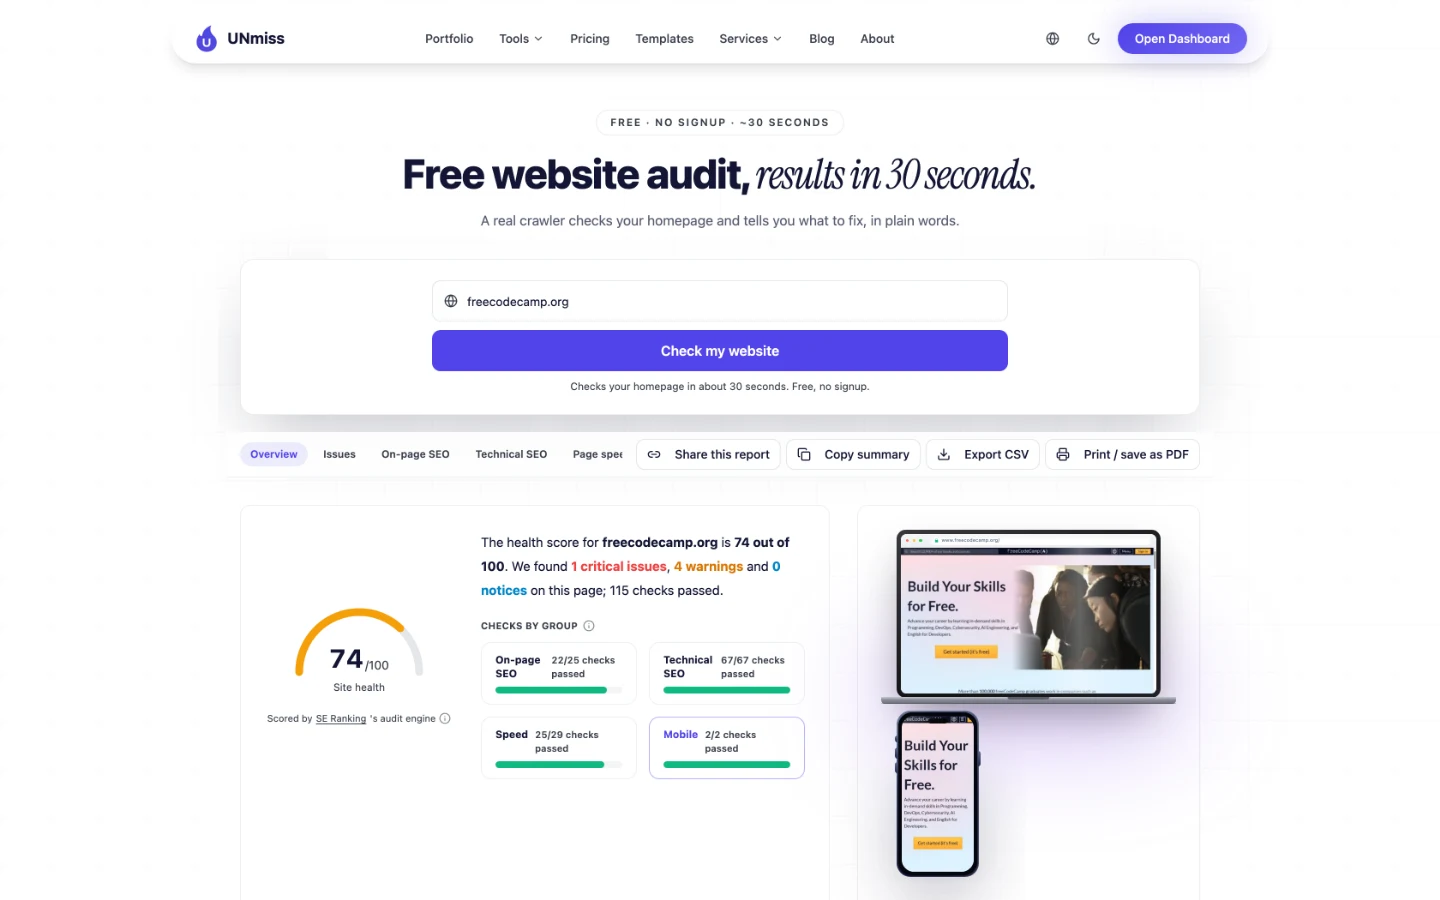
That ties Healthline for the lowest technical score here. Both are growing in keywords. Dribbble and ClinicalTrials.gov both scored a perfect 100 and both are shrinking.
By now that is not a coincidence to remark on, it is the finding: across 18 measured sites, the audit score has had no relationship to search performance in either direction.
So fix your critical issues, because they are cheap and specific and they break real pages. Then take the score off your dashboard, because reporting it every month trains everyone around you to believe it means something.
Build pages that accumulate, not churn
From the Domain Overview: it is positive on both pairs — gaining more keywords than it loses, and improving more than it declines.
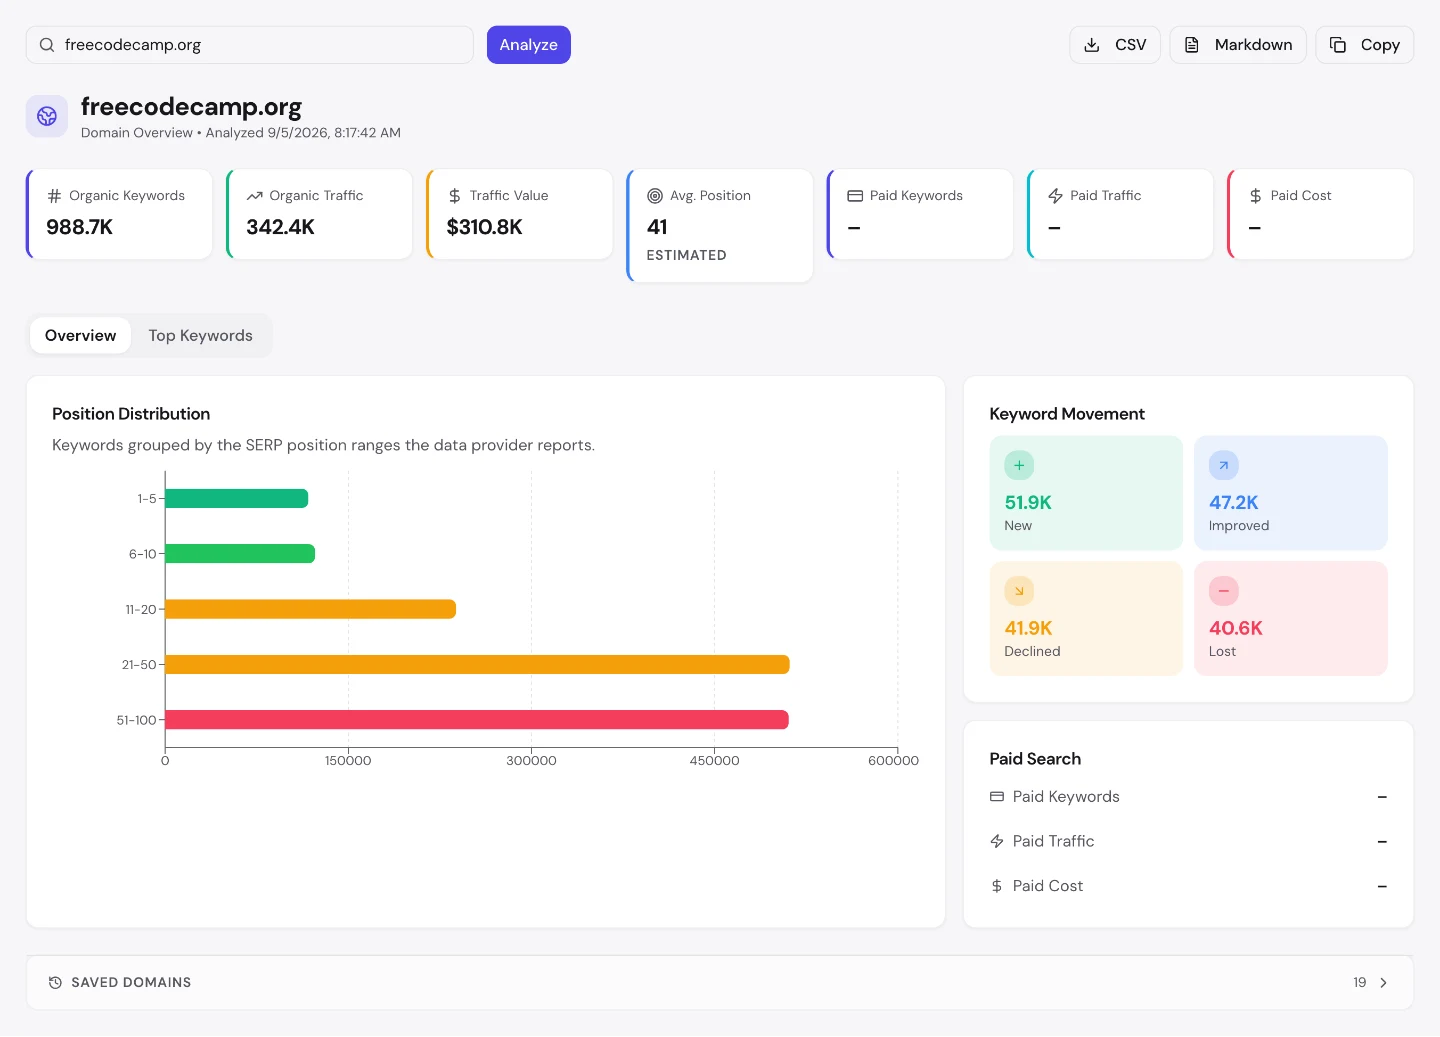
Worth $310K a month, with no paid search whatsoever.
It is one of only 5 sites across these batches positive on both measures, and the utility pages are the reason. They do not expire, so they accumulate instead of churning.
That is the property to look for when you choose what to publish next. Ask whether the page will still be true in 5 years. If it will, every one you add is permanent inventory; if it will not, you are signing up to replace it, and your growth is really a treadmill.
freeCodeCamp is funded by an emoji list and an alt-codes table. GeeksforGeeks by a centimetre converter. The pages that pay for a technical site are usually the small tools its audience needs while learning, not the lessons themselves.
- Volume, difficulty and intent for any term
- Look for queries that describe a task, not a topic
- 3 checks a day, no signup, no card
What you cannot copy
And here is what I could not measure, or had to qualify. A couple of the tools I name below are partners of ours — if you buy through those links we earn a commission, and you do not pay a cent more.
Our traffic figures are United States only and modelled from ranking positions and search volume rather than counted. freeCodeCamp's audience is global — the Chinese anchor at 16% says so plainly — so its worldwide traffic is materially larger than 340K. The keyword and backlink data underneath comes from SE Ranking, and the $310K traffic value is an ad-spend equivalent, not revenue; freeCodeCamp is a non-profit and charges nothing.
The backlink figures came from the app rather than the marketing tool, which has been returning HTTP 429 consistently. The app's BACKLINKS tile is a known defect on our side and has returned negative values elsewhere, so the total is taken from the page header, which reconciles with dofollow plus nofollow, and the screenshot is cropped below that tile.
The sitemap census comes from a full crawl on 29 August 2026, not from this run. It found 16K URLs, of which 13K are posts. Almost all of them are dated 2019 or earlier. I have inferred the Medium migration from the slug format rather than confirming it from freeCodeCamp's own account of it. I did not run Keyword Research: it has an open defect returning implausible volumes.
And what you cannot copy: a decade of volunteer authors. 13K articles from 575 contributors exist because people wanted to teach for free on a platform they believed in. No content budget reproduces that, and the utility-page tactic on its own is a tactic, not a business.
Frequently asked questions
What are freeCodeCamp's most visited pages?
After the homepage at 11% of traffic, an emoji copy-and-paste list at roughly 10K monthly visits ranking 26th, a guide to dropping pins in Google Maps at 7,300, a random number generator at 4,300 ranking 10th, and an alt codes table at 4,300. None of the top 5 is about programming.
How many pages does freeCodeCamp publish?
16K URLs, all under /news/, counted in a full crawl on 29 August 2026 — 13K posts, 2,600 tag pages, 575 author pages and 10 static pages. The curriculum itself is not in the sitemap at all.
How much is freeCodeCamp's search traffic worth?
Our Domain Overview prices it at $310K a month, against 990K ranking keywords at an average position of 41 and roughly 340K estimated US organic visits, measured 5 September 2026. That is an ad-spend equivalent, not revenue — freeCodeCamp is a non-profit and charges nothing.
How much of freeCodeCamp's archive is out of date?
4,200 of its 13K articles carry a Medium-style ID in the slug, and 98% of those have a last-modified date of 2019 or earlier, with only 85 touched since. The heaviest years are 2018 (1,800 URLs) and 2019 (791). Counted 29 August 2026.
What is freeCodeCamp's most common anchor text?
"Technical Writing" with 1.1M backlinks — 40% of the entire profile. Second is FCC网站, the Chinese name for the site, at 440K (16%), and third is a bare URL to a single article, the Docker handbook, at 120K.
How many backlinks does freeCodeCamp have?
2.8M backlinks from 79K referring domains, 88% dofollow, with "Technical Writing" at 1.1M links (40%) and FCC网站 at 440K (16%), measured 5 September 2026, split 2.5M dofollow to 330K nofollow — about 88% dofollow. Domain Trust is 93 out of 100, with 9,700 .edu links and 2,200 .gov.
What is freeCodeCamp's website audit score?
74 out of 100, with 1 critical issue, 4 warnings, 0 notices and 115 checks passed on the homepage. That ties Healthline for the lowest score of the 18 sites measured in this series — and both are among the few growing in keywords.
Is freeCodeCamp gaining or losing keywords?
Gaining. It added 52K keywords and lost 41K, with 47K improved against 42K declined — positive on both pairs, up about 11K against a base of 990K. Utility pages do not expire, so they accumulate rather than churn.
The one number to take away
26.
That is the position at which freeCodeCamp's emoji list ranks for "emoji", and it is the second-biggest page on a site that teaches people to program.
Page 3, on a query with nothing to do with the mission, earning more than any tutorial. GeeksforGeeks has the same shape with a centimetre converter at position 30. Two independent education platforms, the same accidental discovery.
The lesson is not "abandon your subject and publish emoji tables". It is that your audience's searches are not organised the way your curriculum is, and the gap between those two things is usually where the traffic already is.
So go and look at your own top pages sorted by traffic rather than by importance. The ones that embarrass you slightly are the ones doing the work.
Found something in your own report that surprised you, or measure this differently? I would genuinely like to know — the tools used are all free, so you can check every figure yourself. Measured 5 September 2026 unless stated. Domain Overview, Organic Traffic Checker, Website Audit and Backlink Analyzer figures are free runs of our own tools, all United States scope, and all modelled rather than counted where the tool says so. The sitemap census comes from freeCodeCamp's own sitemap, crawled 29 August 2026. No revenue figure applies.