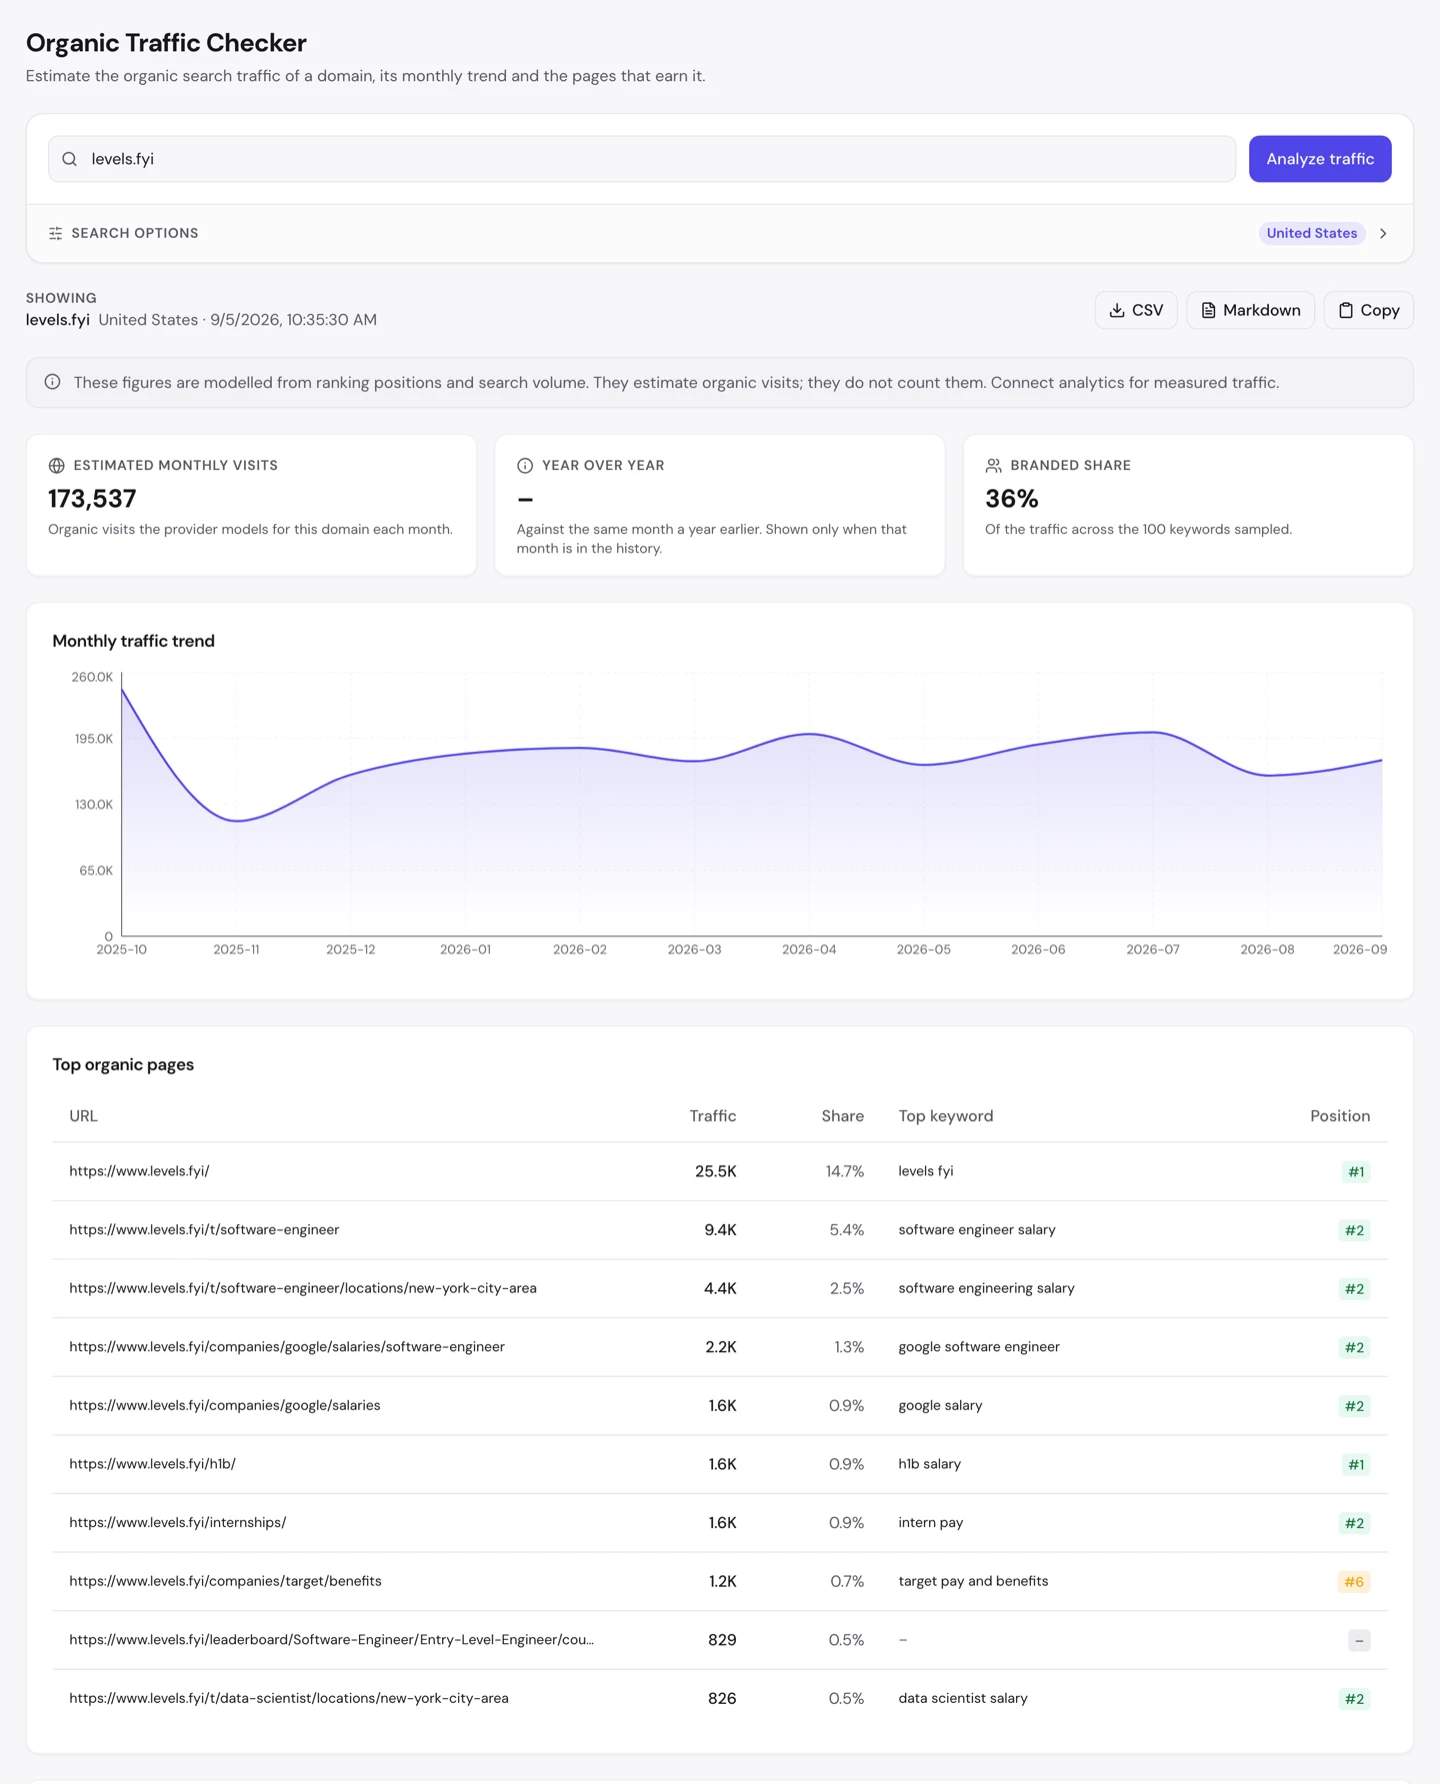
Levels.fyi publishes 530K pages and earns 173K organic visits a month — a third of a visit per page.
And 75% of those pages are the type that earns almost none of it.
I counted every URL in its sitemaps rather than sampling them, then ran the domain through 3 of our tools. The result is the clearest illustration in this series of a catalogue built along the wrong axis — and of the 1 axis inside it that works. Here are the 6 lessons.
Divide your traffic by your page count
The page count is not an estimate. A script walked every leaf of every index and counted the <loc> elements in all 106 files: 530K URLs, against about 173K monthly visits.
That is roughly 1 visit per 3 pages. Put it the other way round: every page Levels.fyi publishes earns about 4 visits a year.
Compare calculator.net, measured the same month with the same free tools: 222 pages, 11M visits. One site publishes 2,400 times more pages and earns 66 times less traffic.
So do that division on your own site before you plan another page. Organic visits, divided by URLs published. It takes a minute and almost nobody has the number.
If yours is small, you do not have a content problem. You have a demand problem, and every page you add makes the ratio worse while making your dashboard look busier.
Slice by role, not by company
Here is where those pages go: company pages are 75% of the site. Role pages are 19%, and everything else — industries, internships, leaderboards — makes up the rest.
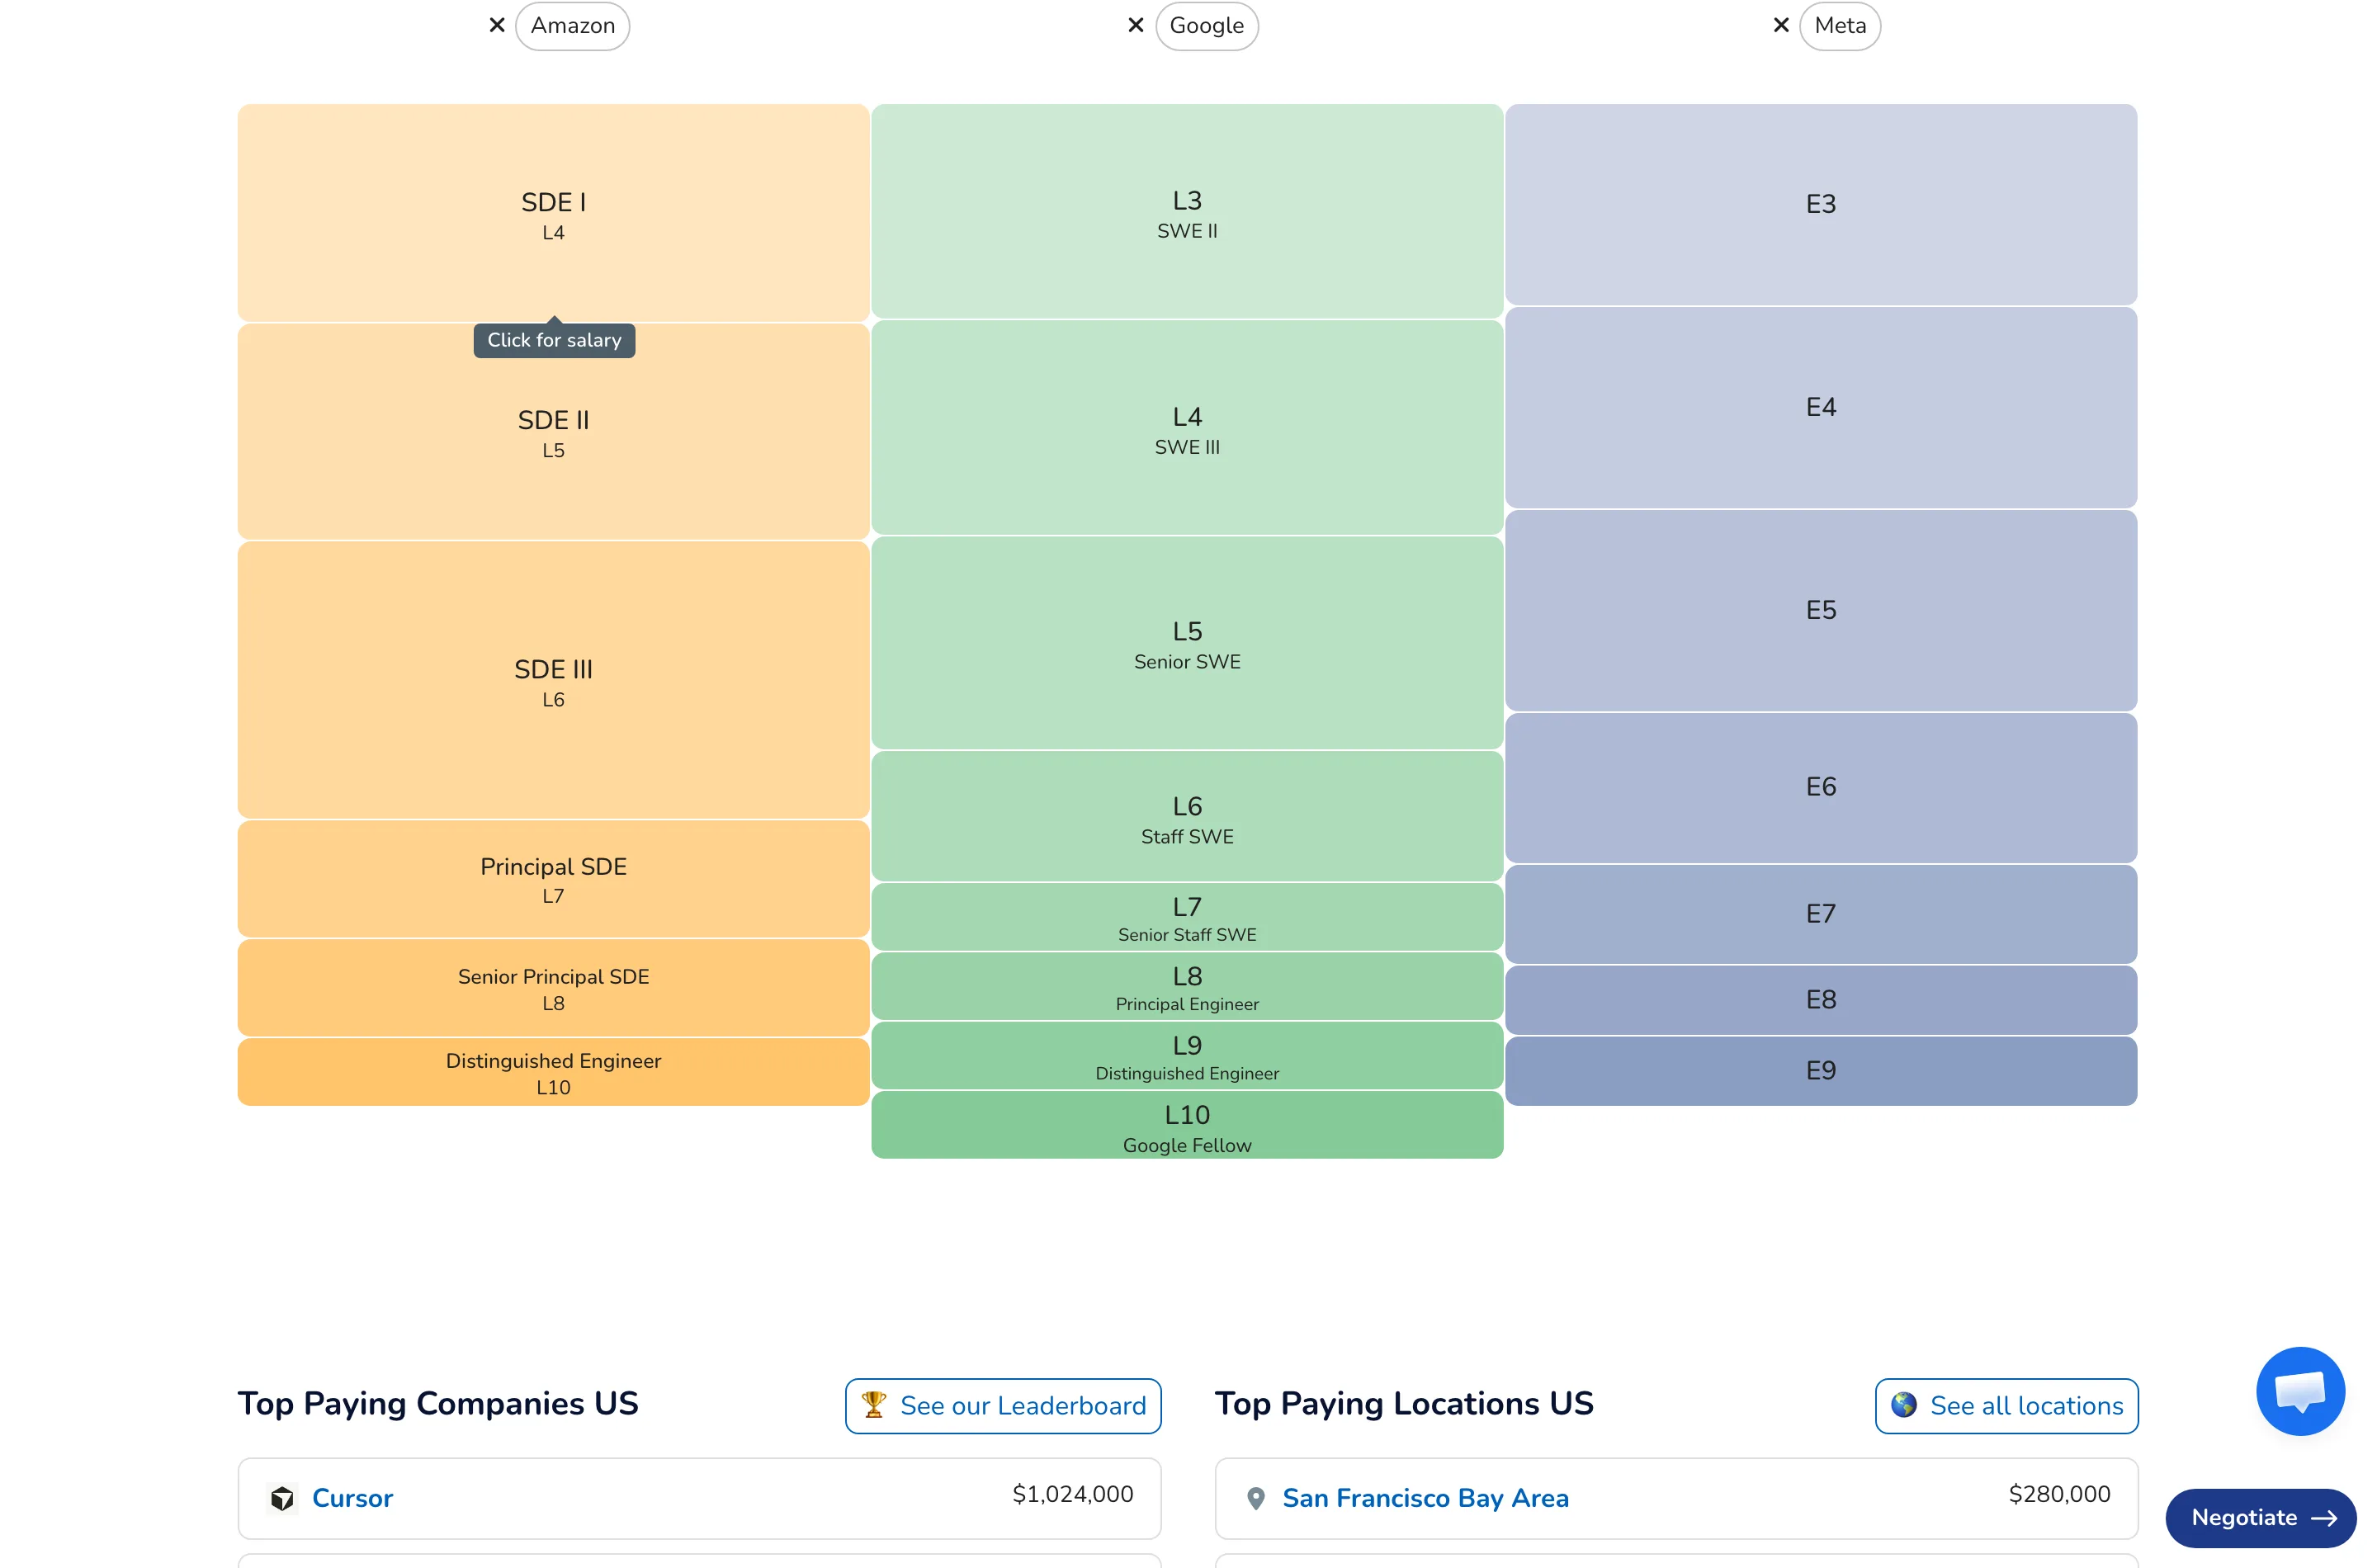
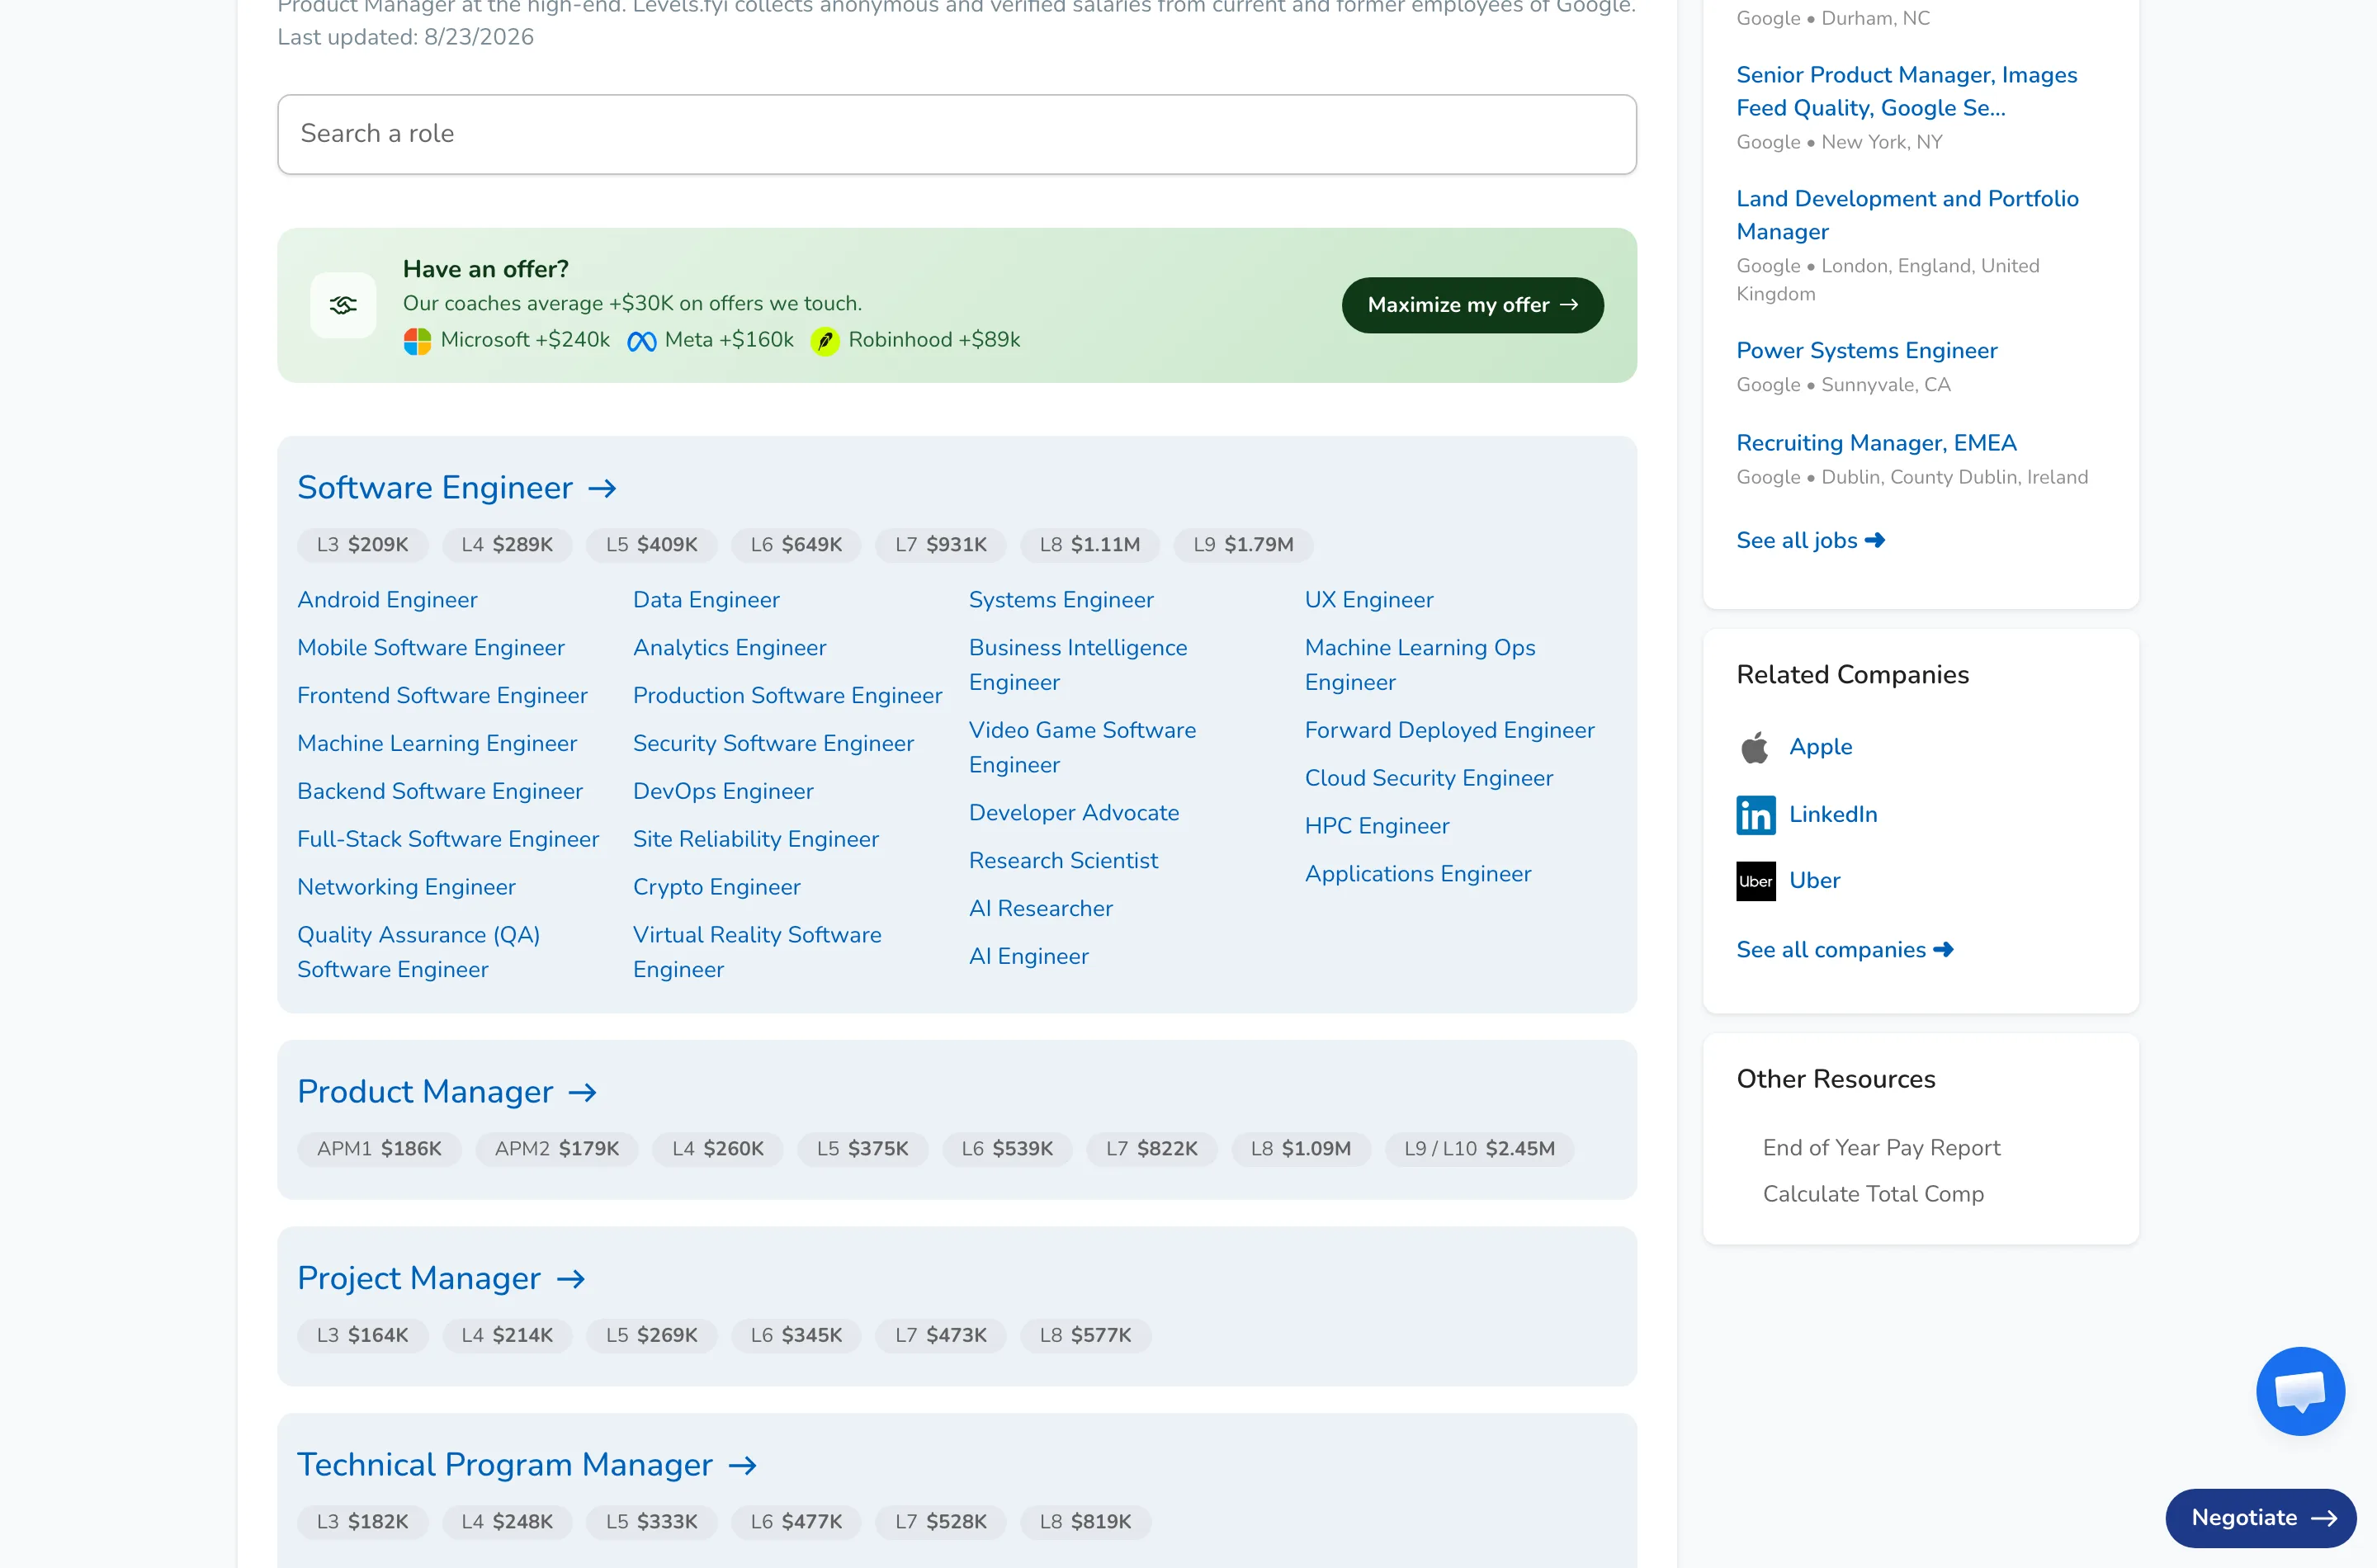
Now look at what actually ranks. The role pages do: /t/software-engineer is 2nd for "software engineer salary", its New York variant 2nd, the data scientist variant 2nd.
Exactly 2 company pages reach the top 10, and both are Google's. Three quarters of the site produces two entries; a layer four times smaller produces most of the rest.
The reason is demand. "Software engineer salary" is searched constantly. "101 Mobility salary" — the first company in the sitemap, a stairlift franchise — is searched by almost nobody.
Every entity catalogue inherits this, including yours: the axis with search demand earns, and the axis with records does not. Your database will offer you the records axis first, because that is the shape the data arrives in.
So price the axis before you build it. Put 20 of your entity names into Keyword Research and see how many return any volume at all.
Free, and enough to see the ratio. If you want to know which of your pages earns its keep, you need visits per page over time, and Semrush and SE Ranking both give you that view.
If your median entity comes back empty, you are about to build inventory rather than traffic — and the honest move is to build the other axis instead, even though it is smaller and less impressive in a plan.
Rank without buying a single keyword
The Domain Overview records no paid keywords at all — no paid traffic, no paid cost — against a branded share of 36%.
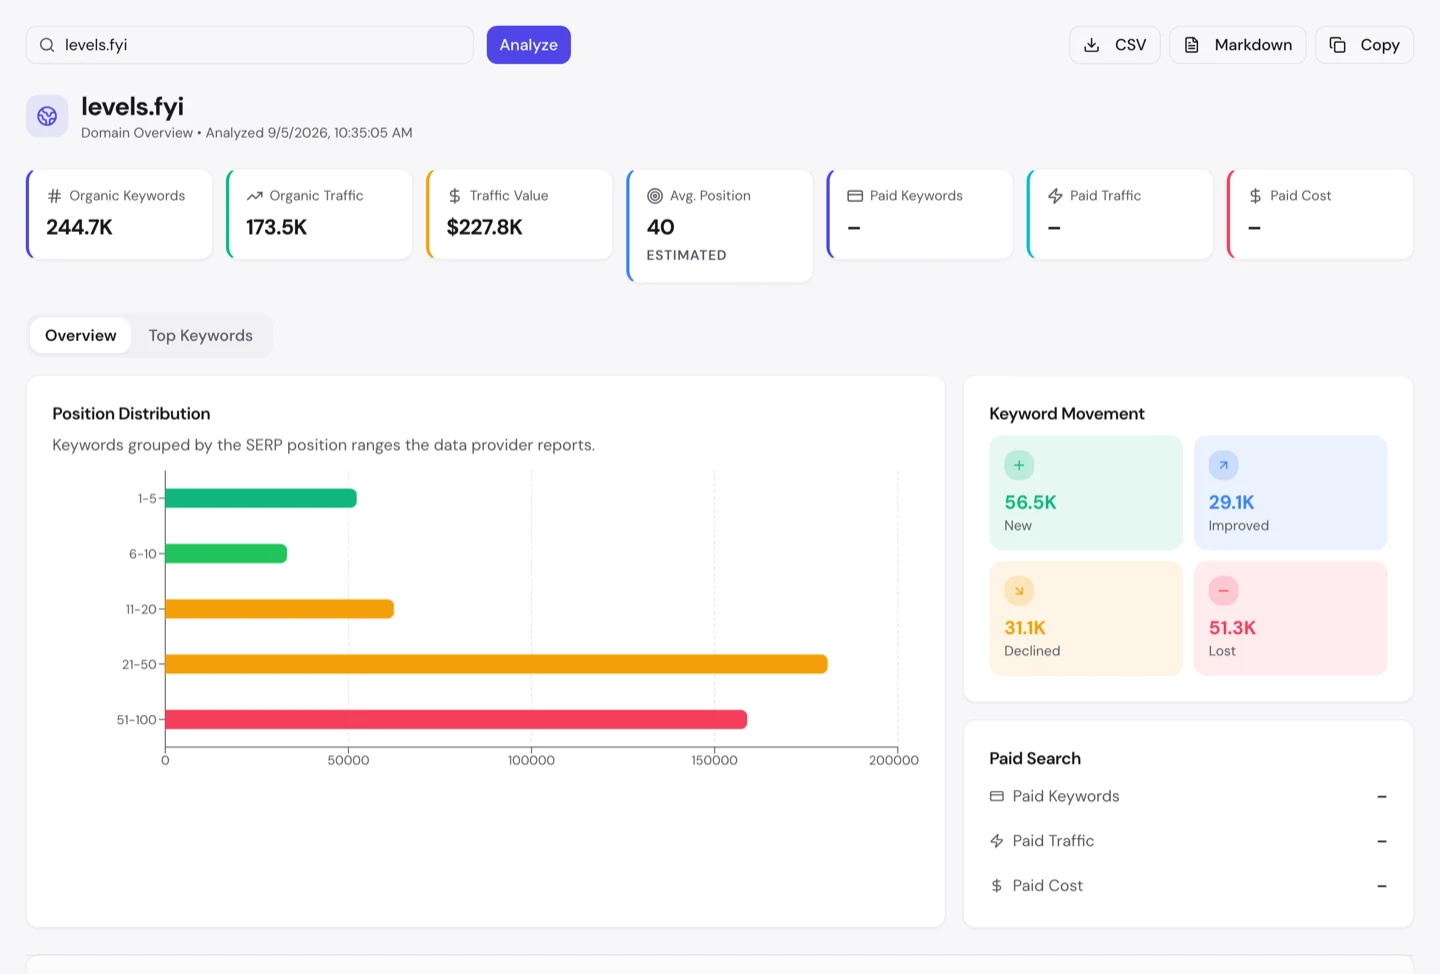
That is worth pausing on. Booking.com buys 96K keywords. NerdWallet buys 3,800. Levels.fyi buys none, and still holds 2nd place on "software engineer salary" against Glassdoor, Indeed and LinkedIn.
Its traffic is worth $230K a month — small next to the others here, and earned entirely by ranking, on a page type any small team could build in a fortnight.
Which is the encouraging part, if your budget is nothing. You are not locked out of a category because a competitor outspends you; you are locked out of the terms they buy. The ones they do not buy are still open, and this site is the proof.
Levels.fyi gets more traffic per page than almost anything here, from a tiny site. You do not need scale to win search. You need the right page type, built once and built well.
- We find the one page type worth repeating
- Designed and built on your stack
- SEO and GEO from day one, not bolted on
- Free call to scope it
More pages will not earn more links
Measured 23 August 2026, our Backlink Analyzer put levels.fyi at Domain Rank 86, from 14K referring domains. That is a small profile for the traffic it earns.
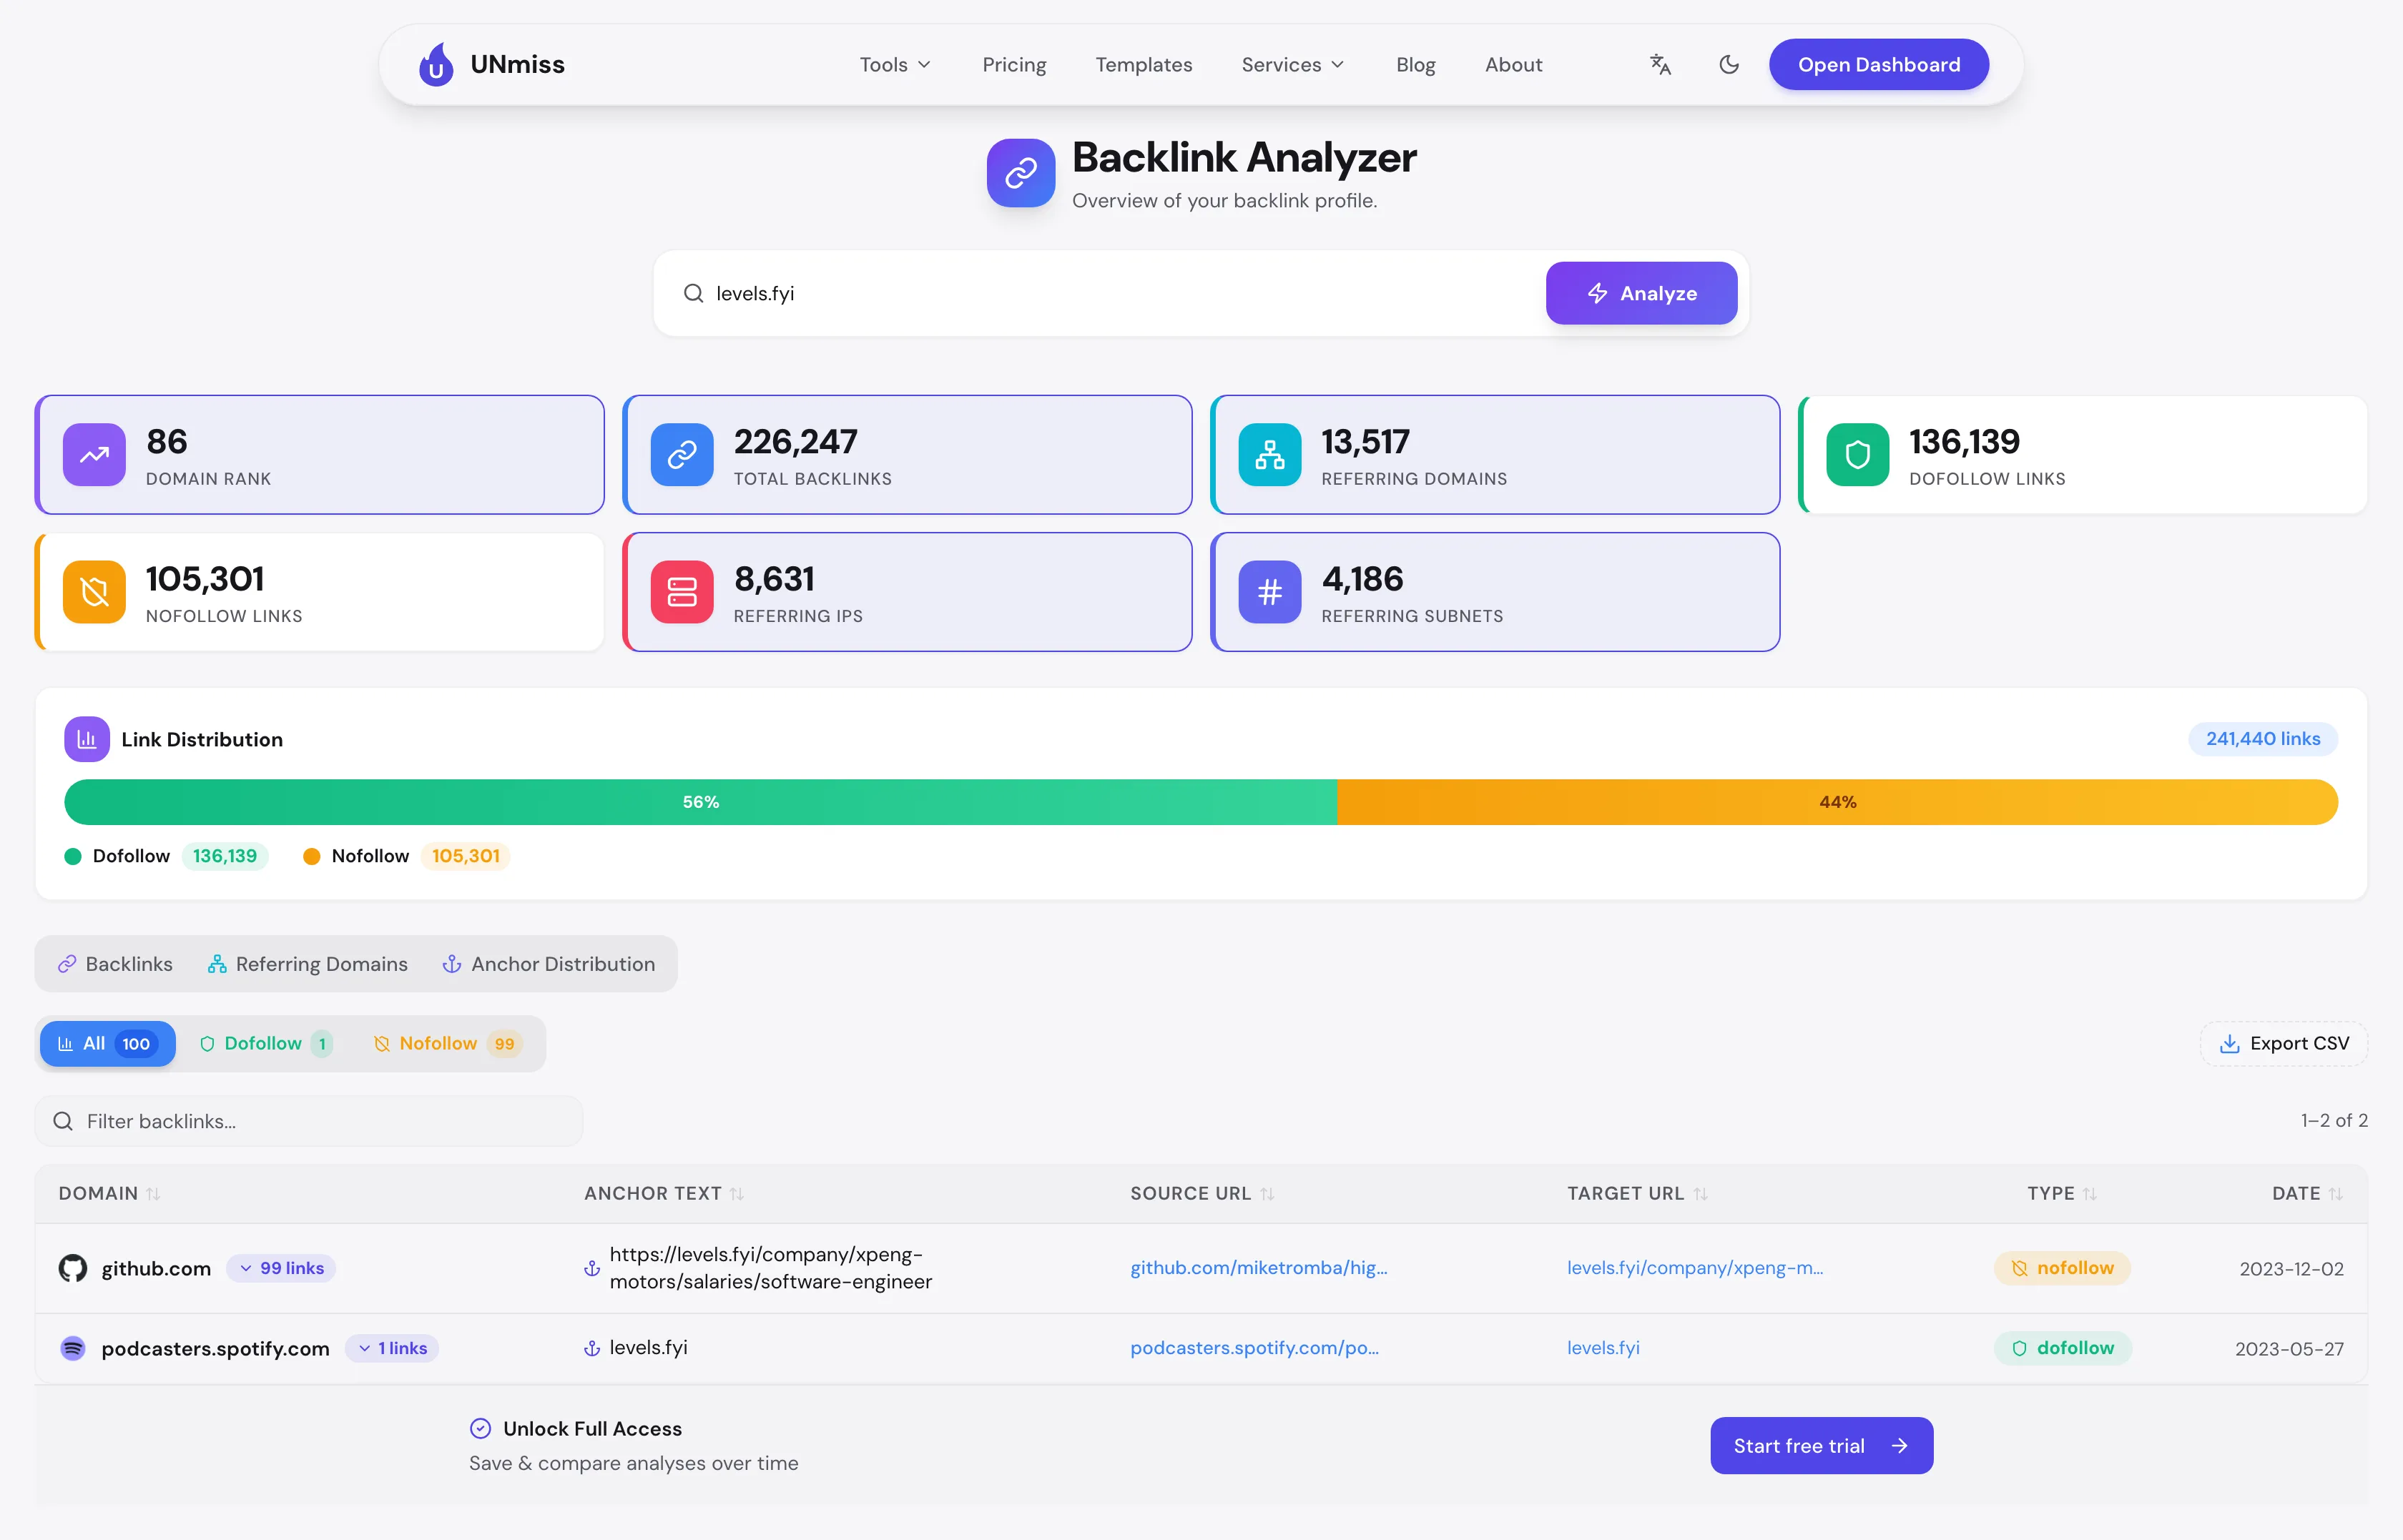
That works out at 1 referring domain for every 39 pages. Calculator.net earns more than twice as many linking websites from a two-thousandth of the page count.
This ratio has fallen in every subject measured here as page count rises, and it is the quiet cost of a large catalogue. Links accrue to pages people have a reason to cite.
Publishing more pages does not create more reasons. It divides the same links across more URLs, and your average page gets weaker every time you ship.
So if your plan says "more pages will bring more links", check it against your own ratio first. You will usually find the opposite has been happening for a year.
Give the homepage 30 minutes a year
The Website Audit scores levels.fyi 86/100, with nothing critical outstanding.
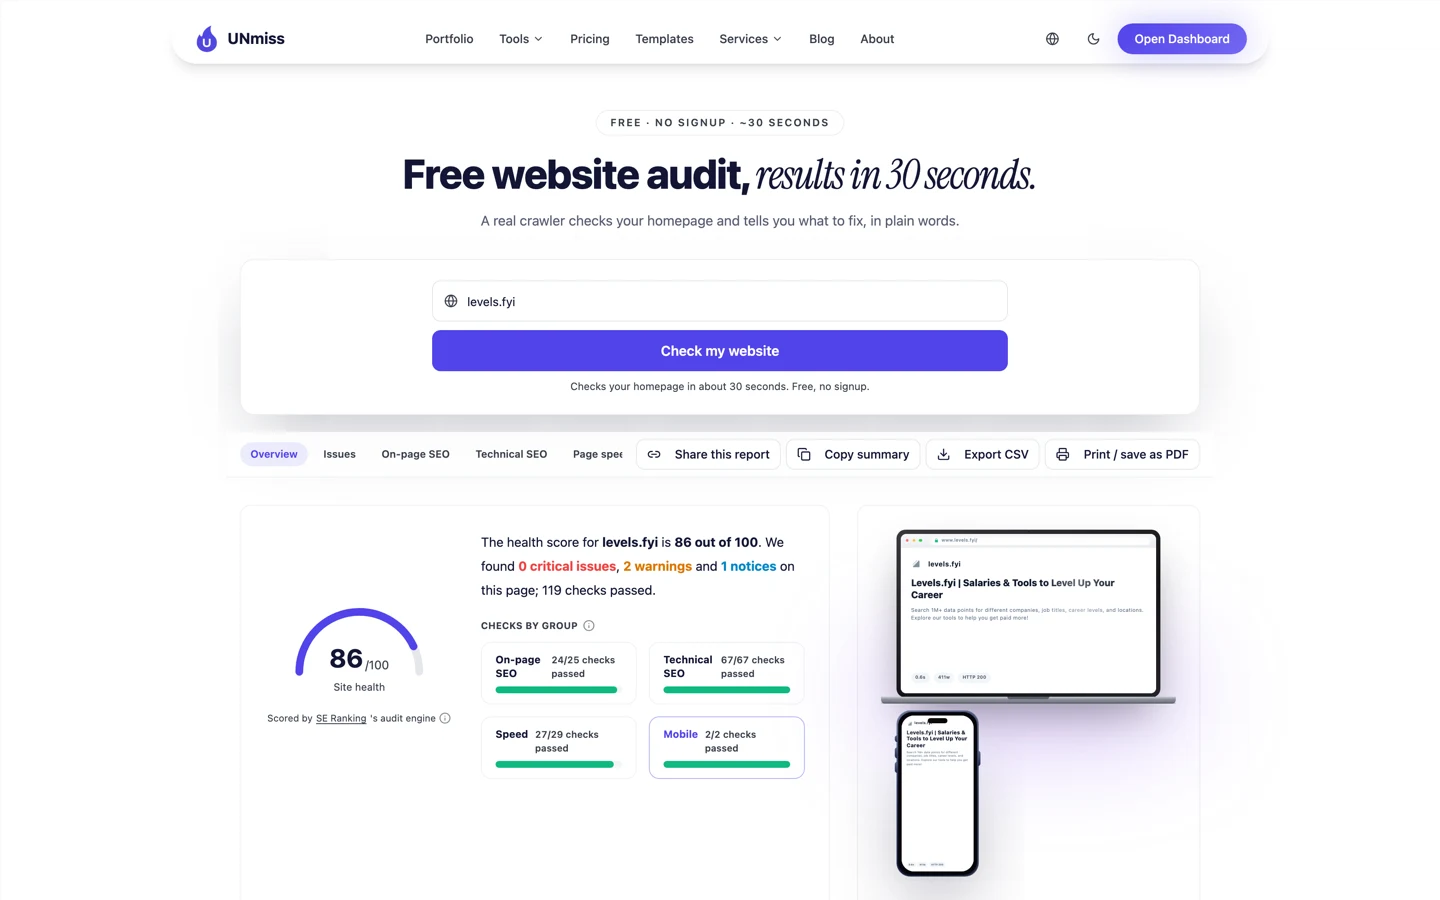
But one of the warnings is no H1 heading on the homepage.
That is a 5-minute fix, and it has sat there while half a million pages were generated. It is the usual trade in a small team: the catalogue gets the attention and the homepage gets none.
Check yours today, because you are almost certainly making the same trade. The pages you generate get reviewed by a template; the page you hand-built three years ago gets reviewed by nobody.
An audit catches this in 30 seconds. A roadmap never will, because nobody ever writes a ticket for the homepage.
Watch which layer your growth lands in
It gains slightly more keywords than it loses, and is roughly flat on quality — a catalogue in steady state, still adding companies and still losing the ones that never earned.
The interesting part is where the additions land. Almost all of them are in the layer that does not rank, so the totals move and the traffic does not.
That is the reporting trap to avoid on your own site. "We added 56K keywords this quarter" is true and means nothing if they all arrived in the layer that has never earned a visit.
Split your movement by page type before you report it. If the growth is all in the layer you already know does not work, you have measured your publishing rate, not your progress.
Levels.fyi's biggest page type is 75% of its site and 2 of its top 10 pages. The top-pages report shows you the same split for your own catalogue in thirty seconds.
- Traffic, share, top keyword and position for every top page
- Branded share, so you know what your name is doing for you
- 3 checks a day, no signup, no card
What you cannot copy
And here is what I could not measure, or had to qualify. A couple of the tools I name below are partners of ours — if you buy through those links we earn a commission, and you do not pay a cent more.
You cannot copy the data. Levels.fyi ranks because it has verified compensation submissions that nobody else has. The page template is simple and the URL structure is guessable; the dataset behind it took years of user trust to build. Copy the structure without the data and you have 530K empty pages.
Our traffic figures are United States only and modelled from ranking positions and search volume rather than counted. The keyword data comes from SE Ranking, and $230K is an ad-spend equivalent, not revenue.
The page counts are ours and were counted rather than sampled, but they are from 23 August 2026, not this run. The backlink figures are from the same date — our Backlink Analyzer returned "Daily backlink check limit reached" on 5 September, so the older dated measurement is quoted rather than a fresh one.
Two of our own tools failed on this subject and neither result is published. Keyword Research returned a monthly volume of 137 for "software engineer salary" and −9 for "google software engineer salary" — a negative search volume is a defect in our tool, not a finding about Levels.fyi. The AI Visibility Checker derived the category "Salaries Tools" and asked 6 questions phrased around it, which is not a phrase anyone types, and 3 of its 6 engines returned "not reached".
One capture note, because it nearly put a wrong figure in this article. Levels.fyi resolves currency from the visitor's IP, and from this machine it rendered every salary in Bangladeshi taka per month. The first screenshots were captured that way and discarded; the script now pins the session to USD and yearly before loading.
Frequently asked questions
How many pages does Levels.fyi have?
530K, counted on 23 August 2026 by walking all 106 sitemap leaf files rather than sampling. Company pages are 400K of them, role pages 98K, industry pages 14K, and everything else 20K — against 173K estimated monthly visits.
How much traffic does Levels.fyi get?
Roughly 173K estimated US organic visits a month, measured 5 September 2026 — about 1 visit per 3 pages, or 4 visits per page per year. For contrast, calculator.net earns 11M visits from 222 pages.
Which Levels.fyi pages rank best?
Role pages. /t/software-engineer ranks 2nd for "software engineer salary", its New York variant 2nd, and the data scientist variant 2nd. Only 2 company pages reach the top 10, both Google's — despite company pages being 75% of the site.
Does Levels.fyi run search ads?
No. Our Domain Overview records no paid keywords, no paid traffic and no paid cost. Booking.com buys 96K keywords, NerdWallet 3,800 and Canva 1,400 over the same period.
How many backlinks does Levels.fyi have?
230K backlinks from 14K referring domains at Domain Rank 86, 56% dofollow, measured 23 August 2026. That is 1 referring domain per 39 pages; calculator.net earns 32K referring domains from 222 pages.
What is Levels.fyi's website audit score?
86 out of 100, with 0 critical issues, 2 warnings and 1 notice, and 119 checks passed. Its traffic is worth $230K a month across 240K keywords at an average position of 40. The warnings are a missing H1 on the homepage and a slow Largest Contentful Paint in the lab; the notice is too many JavaScript files.
How much is Levels.fyi's search traffic worth?
Our Domain Overview prices it at $230K a month, against 240K ranking keywords at an average position of 40, measured 5 September 2026. That is an ad-spend equivalent, not revenue.
Is Levels.fyi gaining or losing keywords?
Gaining slightly. It added 56K keywords and lost 51K — net up about 5,200 — with 29K improved against 31K declined, so quality is roughly flat.
The one number to take away
2.
That is how many of Levels.fyi's 400K company pages reach its top 10 — and both of them are Google.
Three quarters of a half-million-page site does almost nothing, while a layer 4 times smaller carries the traffic. Nobody built it wrong on purpose. Company pages are the obvious axis: the data arrives shaped that way, one row per employer, and generating them is trivial.
The axis that is easiest to generate is rarely the axis people search. "Software engineer salary" has demand. "Salary at a stairlift franchise" does not, and there are 400K pages in that second category.
So do the cheap thing before the expensive one. Take the 20 biggest entity names in your database, check whether anyone searches them, and if the answer is no, build the role page instead. It costs an afternoon, and it is the difference between 173K visits and calculator.net's 11M.
Found something different in your own report? I would genuinely like to know — the tools used are all free, so you can check every figure yourself. Domain Overview, Organic Traffic Checker and Website Audit figures were measured on 5 September 2026, United States scope, and are modelled rather than counted where the tool says so. Page counts and backlink figures were measured on 23 August 2026. No revenue figure for Levels.fyi was available to us.